Bitcoin price started a short-term downside from $6180 against the US Dollar. BTC/USD might continue lower towards the $5400 support.
Key Talking Points
- Bitcoin price after setting a new all-time high near $6200 (data feed by Kraken) against the US Dollar started a short-term downtrend.
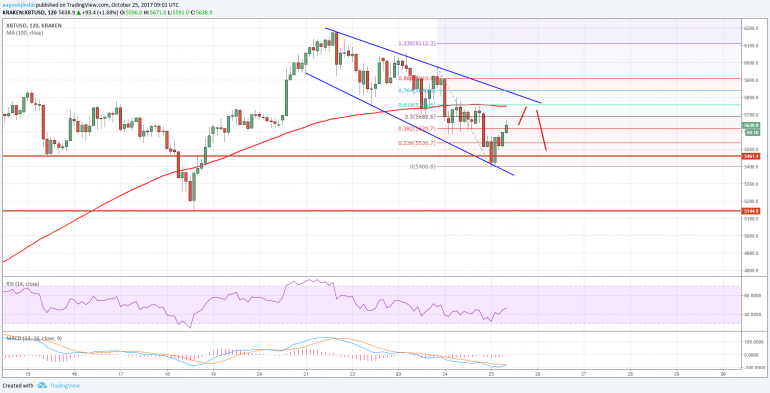
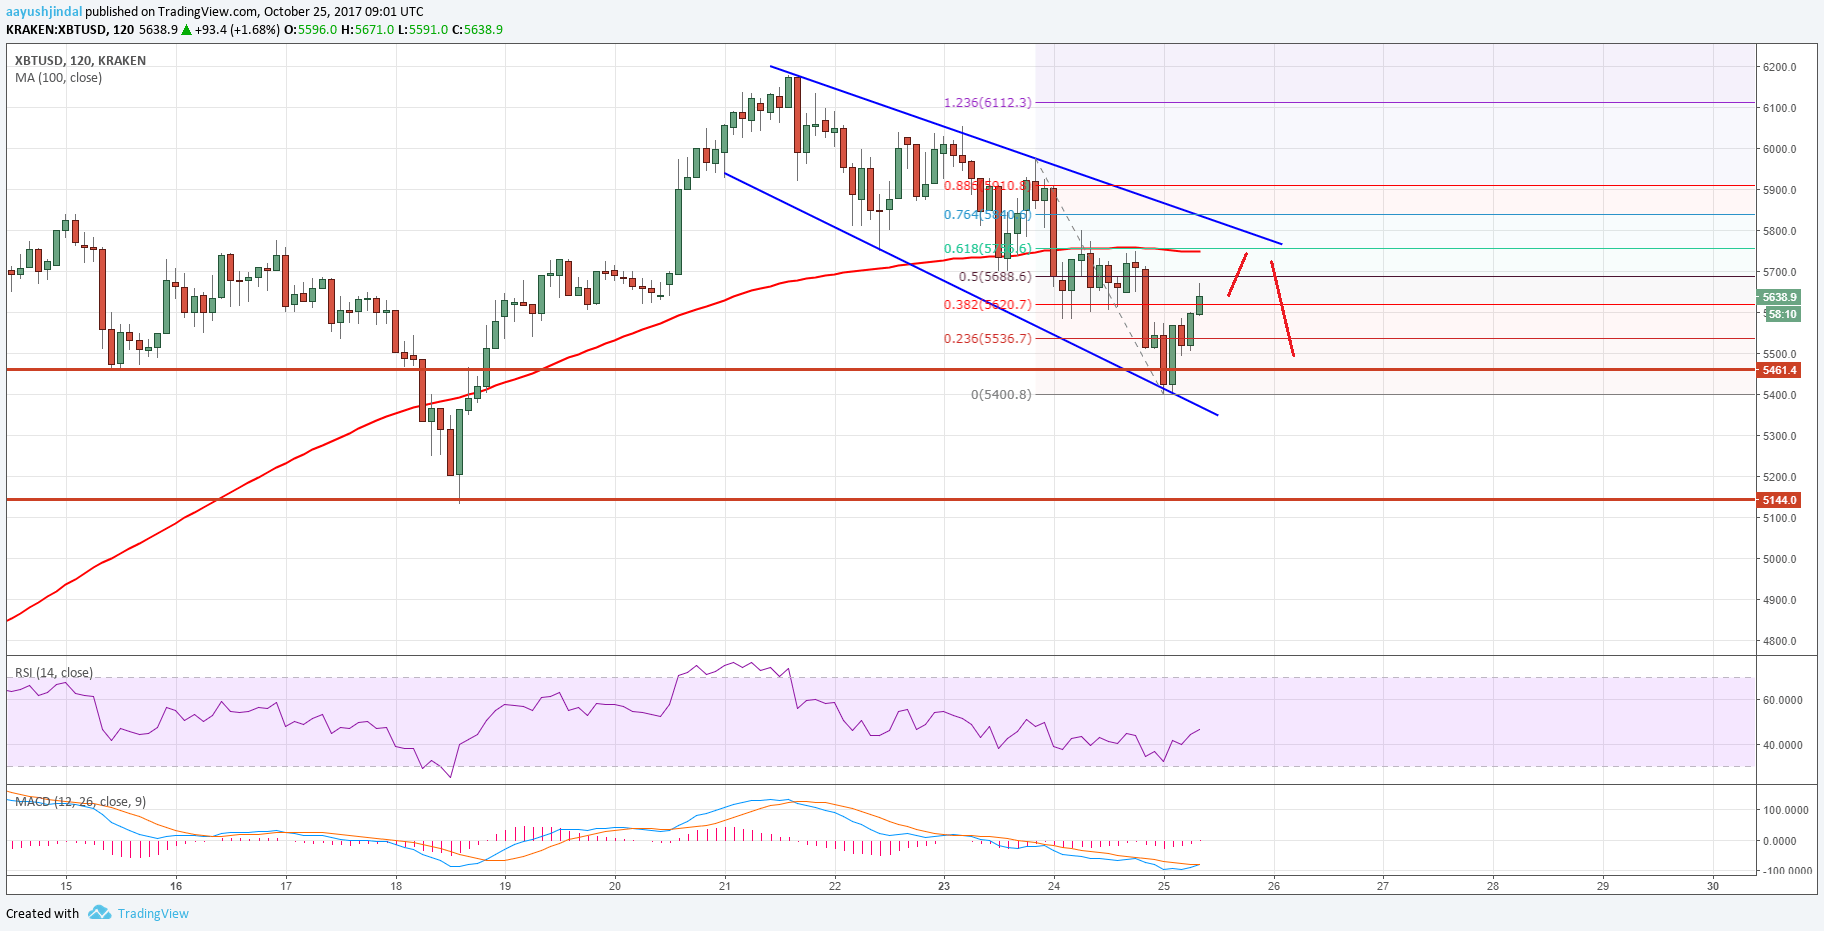
- There is an expanding triangle forming with declining bias and resistance near $5760 on the 2-hour chart of BTC/USD.
- The pair might test the triangle resistance and will most likely decline back towards $5450.
Bitcoin Price Chart Analysis
We witnessed decent gains in bitcoin price until it faced sellers near $6180-6200 against the US Dollar. The price started a short-term correction and moved below the $6000 handle. There was even a close below the $5700 support and the 100 simple moving average (2-hour).
The price traded as low as $5400 where it found buyers and is currently correcting higher. It has moved above the 23.6% Fibonacci retracement level of the last decline from the $5971 high to $5400 low.
However, there are many hurdles waiting on the upside near $5700 and $5750. An initial resistance is around the 50% Fibonacci retracement level of the last decline from the $5971 high to $5400 low at $5688. Above the mentioned $5688, the 100 SMA (2-hour) is positioned at $5750.
Moreover, there is an expanding triangle forming with declining bias and resistance near $5760 on the 2-hour chart of BTC/USD. The $5750-5760 resistance zone is also near the 61.8% Fibonacci retracement level of the last decline from the $5971 high to $5400 low.
Therefore, it seems like the $5750 resistance is a major hurdle for buyers in the near term. A close above $5750 won’t be easy. If buyers succeed, there is a chance of BTC/USD retesting the $6000 handle.
On the other hand, a failure to move above $5700 and $5750 would ignite a downside push back towards $5450 and $5400. Overall, the short-term trend is bearish as long as the price is below $5750. On the positive side, the 2-hour RSI for BTC/USD is moving higher and showing bullish signs.
Trade safe traders and do not overtrade!
Read Also:
-
Invest in Ripple, Cheap and Profitable!
-
NEO Coming Strong On Oct 24 Making It Above $30.00
-
Stellar Lumens Showing Signs of a Strong Uptrend
– Follow us on our Facebook and Twitter pages.


