Latest Bitcoin News
Unfortunately, traders who had their Bitcoins and other digital assets at a small Canadian Exchange, MapleChangeEx, are now counting losses following a hack on Sunday. The exchange said “some people” were able to exploit a bug and withdrawing all the exchange’s—including customers—funds. What’s even worse is that the exchange is shutting down with no plans of refund until after the investigation is over. However, they are opening up their wallet allowing traders to withdraw whatever they can.
https://twitter.com/MapleChangeEx/status/1056663998051975168?ref_src=twsrc%5Etfw
This is a word of caution: don’t leave your coins at exchanges. More so, don’t dare store your coins at exchanges without multi-Sig cold storage. Remember, if you don’t have custody of your private keys they you don’t own anything. You are your own responsibility of SAFU.
https://twitter.com/iamjosephyoung/status/1056610591152922624
Secondly, always open accounts in exchanges that are open to regulation, are transparent and have the community backing. There is always a recourse whenever such hacks happen. Hacks at Coincheck and Zaif did draw regulator involvement and most assuredly, there is victim compensation.
While the crypto market tries to reassure potential investors of their platform’s security, Bitcoin volatility is tapering. As visible from the charts, BTC/USD has been moving within a tight weekly $350 range. The volatility is almost 10 times lower than it was in January. Recent findings from the CBoE indicate that Bitcoin volatility is lower than those of high market cap stocks as Netflix and Amazon. Their volatility exceeds 35 percent while the 20-day Bitcoin volatility stands at 31.5 percent.
BTC/USD Bitcoin Price Analysis
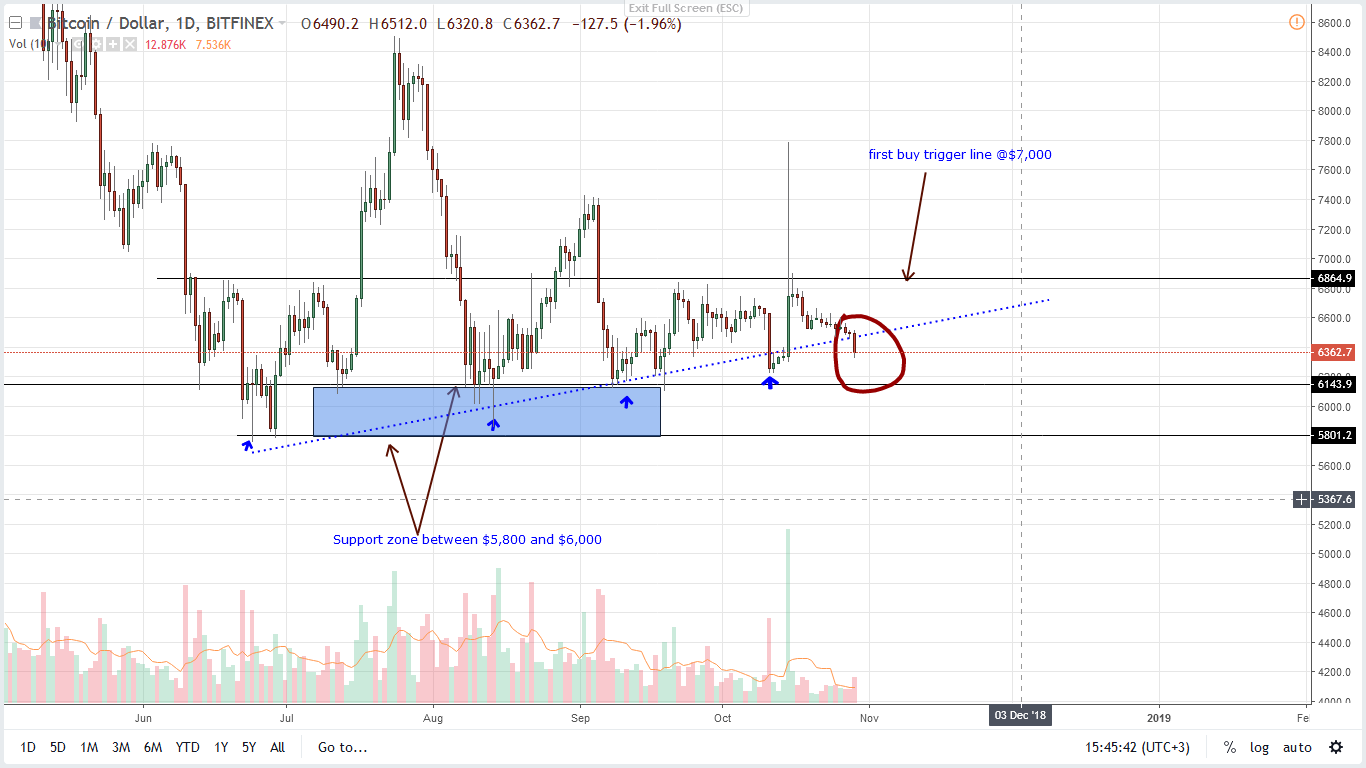
Two weeks later and Bitcoin prices are stable to say the least. Though typical of an accumulation, the lack of activity is bad business for scalpers but beneficial for long term investors desirous of institutional and other HNW involvement. BTC is down roughly three percent in the last week and 1.4 percent in the past 24 hours.
Trend: Flat
Despite dropping three percent in the last week, losses in the last day is now up two percent. BTC is down $130 in the last 15 hours. Regardless, prices are in range mode as they move inside Oct 15 high low. We remain categorical only expecting bears to stop us out once there are losses below $6,200 or Oct 14 lows. Before then, we remain upbeat expecting prices to bottom following a +75 percent drop from 2018 highs in the last 10 months.
Market Participation: Bear volumes picking up, shoots to 11.5k
Oct 15 volumes stood at 85K. Even if losses were expected, it seems like sellers are stepping up keen on reversing Oct 15 gains. Today’s volumes is up to 11.5k which is almost double those between Oct 20 and Oct 28. At this time frame, BTC average volume stood at 6k. This point to either ecstatic end of bears OR a resumption of bear trend. That’s why how today’s bar close is important.
Candlestick Formation: Bear Breakout
Today’s strong bear bar mean prices are now trending below the minor support trend line. Technically, this is bearish. Therefore, should tomorrow print lower then odds are BTC/USD pair will see losses below $6,000 completing a bear break out trade.
Conclusion
All our trade indicators point to bears. But since the market is relatively calm following the last two weeks consolidation and trading inside Oct 15 high-low, we recommend patience knowing that if prices dip below $6,200, our previous BTC/USD shall be invalidated.
All charts courtesy of Trading View
This is not trade advice. Do your own research.


