Dash price recovered well from the $265 support against the US Dollar. However, DASH/USD needs to overcome the $300 hurdle to gain traction.
Key Talking Points
- Dash price is currently trading above the $280 and $265 support levels (data feed by Kraken) against the US Dollar.
- There is a major bearish trend line forming with resistance at $295 on the 2-hour chart of DASH/USD.
- The pair has to settle above the $300-310 levels to move back in the bullish zone.
Dash Price Chart Analysis
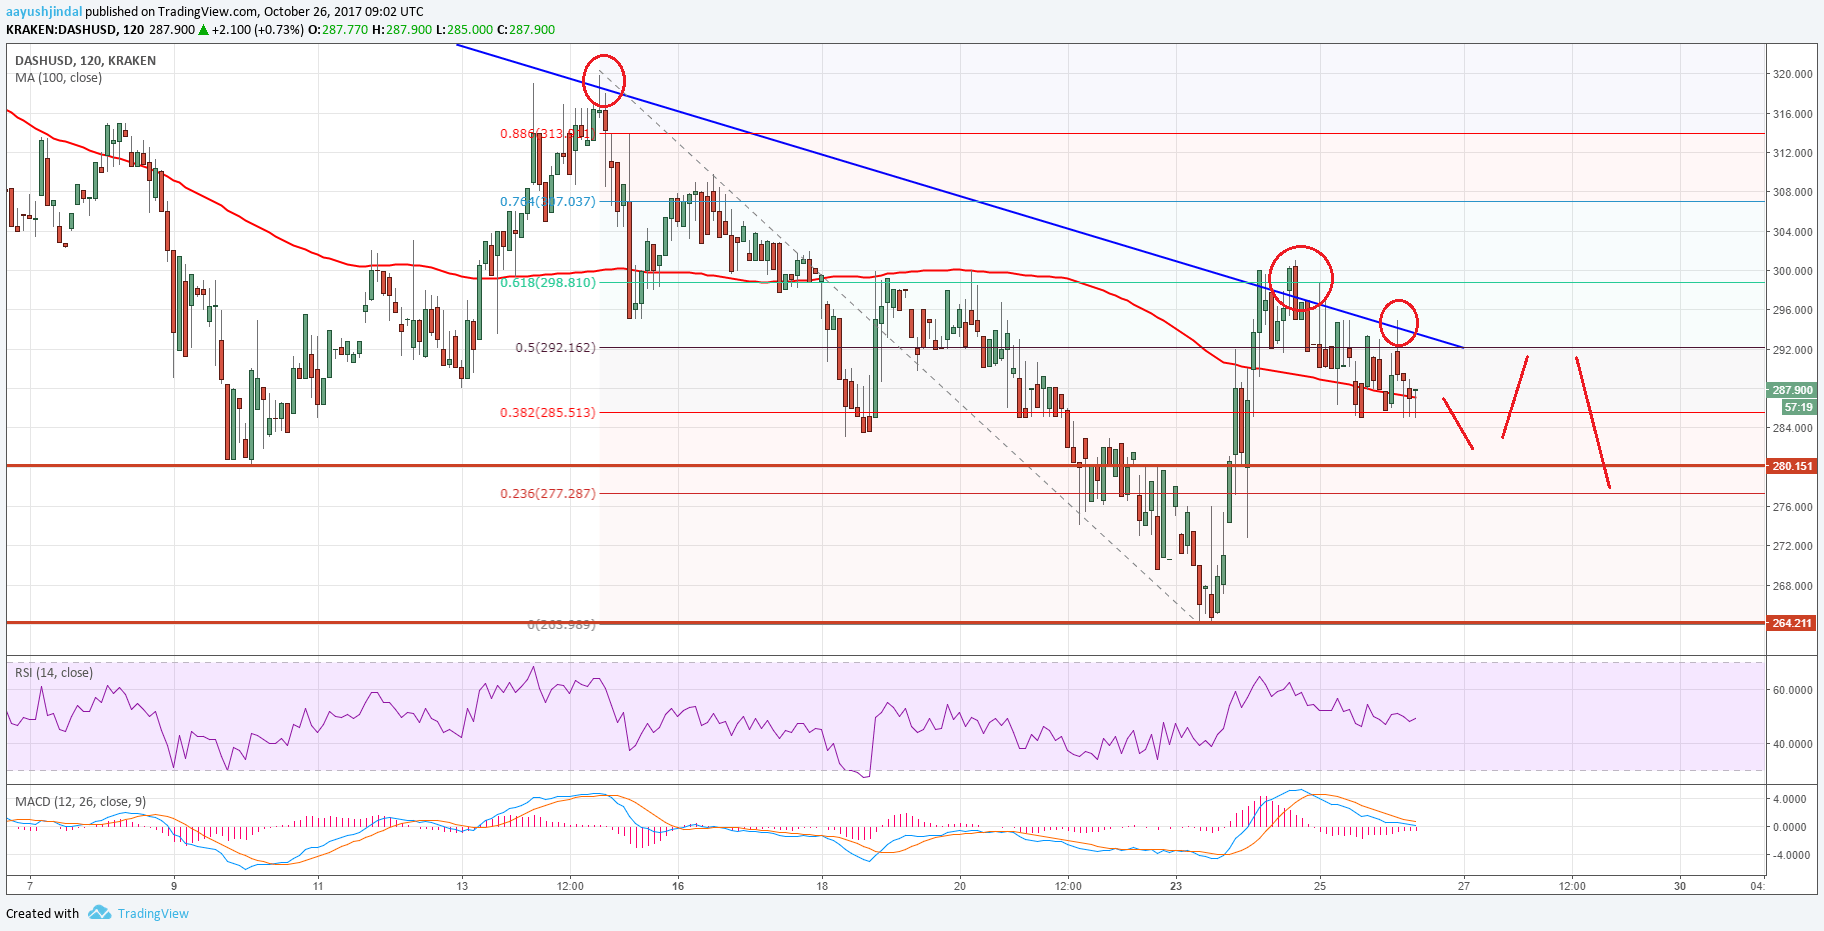
We saw a sharp decline in Dash price towards the $260-250 support area against the US Dollar. The price traded as low as $264 from where a short-term correction was initiated.
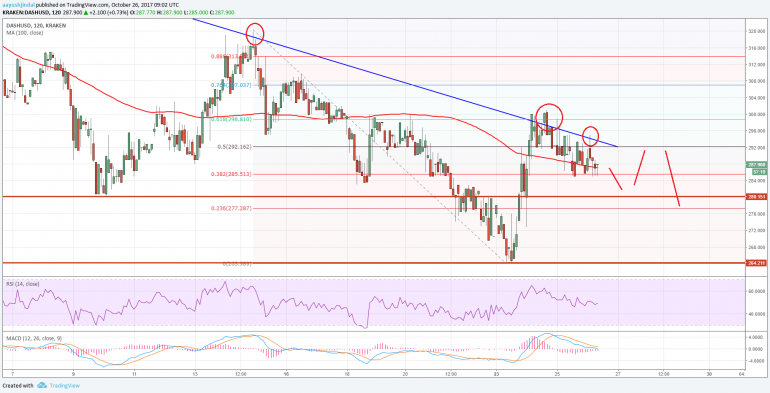
The price moved above the $280 resistance and the 23.6% Fibonacci retracement level of the last decline from the $320 high to $264 low. However, the upside move was protected by the $300 handle and a major bearish trend line with resistance at $295 on the 2-hour chart of DASH/USD.
Moreover, the 61.8% Fibonacci retracement level of the last decline from the $320 high to $264 low prevented gains and stopped buyers from taking control.
The pair is currently trading near the 100 simple moving average (2-hour) and remains well supported above the $280 support. However, buyers need to gain momentum above the trend line resistance and the $300 handle to initiate a new bullish wave.
In the short term, it seems like there are chances of a downside move back towards $280 before Dash price makes an attempt to surpass the $300 resistance.
If buyers fail to defend losses near $280, there can be a retest of $265. The 2-hour MACD for DASH is recovering and may soon move back in the bullish zone. However, the RSI is signaling a divergence below 60.
Therefore, we can witness a few more swing moves toward $280-265 before there can be an upside break in DASH/USD above $300.
Trade safe traders and do not overtrade!


