EOS price declined heavily and broke the $2.00 and $1.80 support levels against the US Dollar. Sellers remain in control as long as the price is below $2.25.
Key Talking Points
- EOS price declined significantly after it settled below the $4.00 support (Data feed of Kraken) against the US Dollar.
- There is a crucial bearish trend line formed with resistance at $2.20 on the 4-hours chart of the EOS/USD pair.
- The pair remains sell on rallies as long as there is no close above $2.25.
EOS Price Analysis
During the past few days, there was a steady decline from the $3.50 swing high in EOS price against the US Dollar. The EOS/USD pair broke the $3.00 and $2.00 support levels to enter a major downtrend.
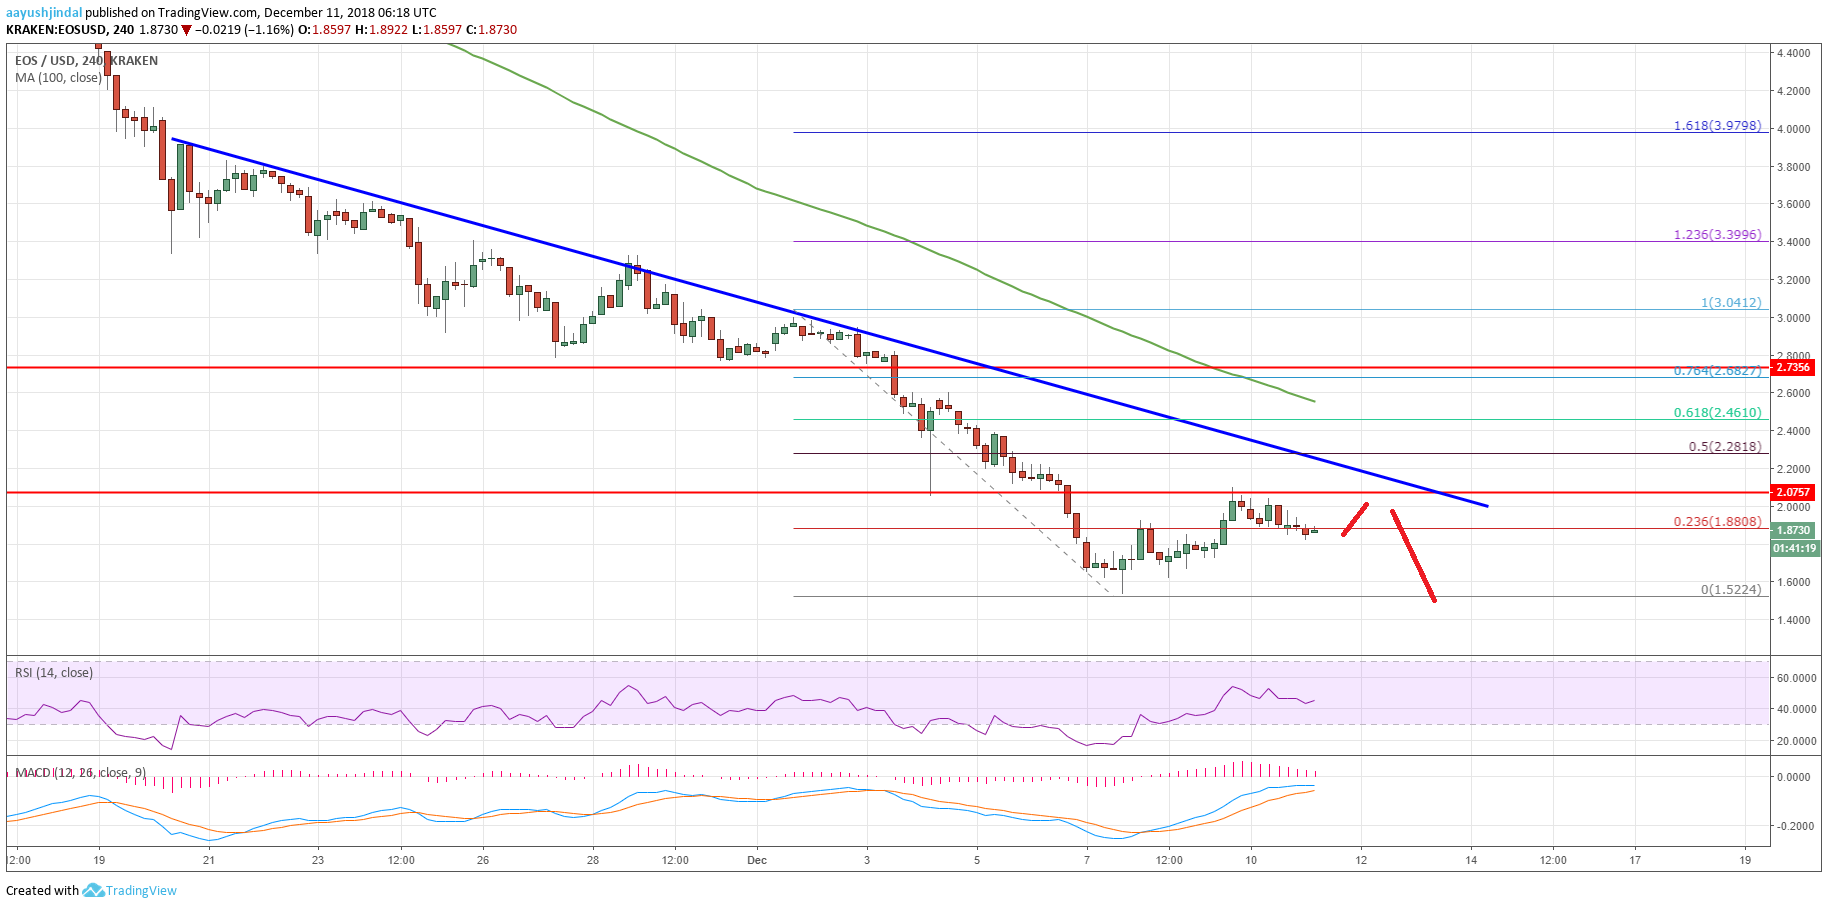
The chart above indicates that EOS price even broke the $1.80 support level and settled below the 100 simple moving average (4-hours). The decline was such that the price traded close to the $1.50 zone and formed a low at $1.52.
Later, the price corrected higher above the $1.60 and $1.80 resistance levels. It also moved above the 23.6% Fib retracement level of the last decline from the $3.04 high to $1.52 low.
However, there are many hurdles for buyers near the $2.00 and $2.20 levels. More importantly, there is a crucial bearish trend line formed with resistance at $2.20 on the 4-hours chart of the EOS/USD pair.
Above the trend line, the next main resistance is near $2.25 and the 50% Fib retracement level of the last decline from the $3.04 high to $1.52 low. As long as the price is below the $2.25-2.30 resistance zone, it remains in a strong downtrend.
Above $2.30, the price may perhaps rise towards the $2.50 level and the 100 simple moving average (4-hours). On the downside, an initial support is at $1.80, below which EOS price may drop back to $1.50. The overall trend remains bearish unless buyers gain pace above $2.25 in the near term. Similarly, litecoin and ripple are struggling to gain bullish momentum above key resistances.
The market data is provided by TradingView.


