Litecoin price formed a solid support near $110 and recovered against the US Dollar. LTC/USD broke the $116 resistance and is currently trading in a positive zone.
Key Talking Points
- Litecoin price formed a key bottom near $110 and surged higher (Data feed of Kraken) against the US Dollar.
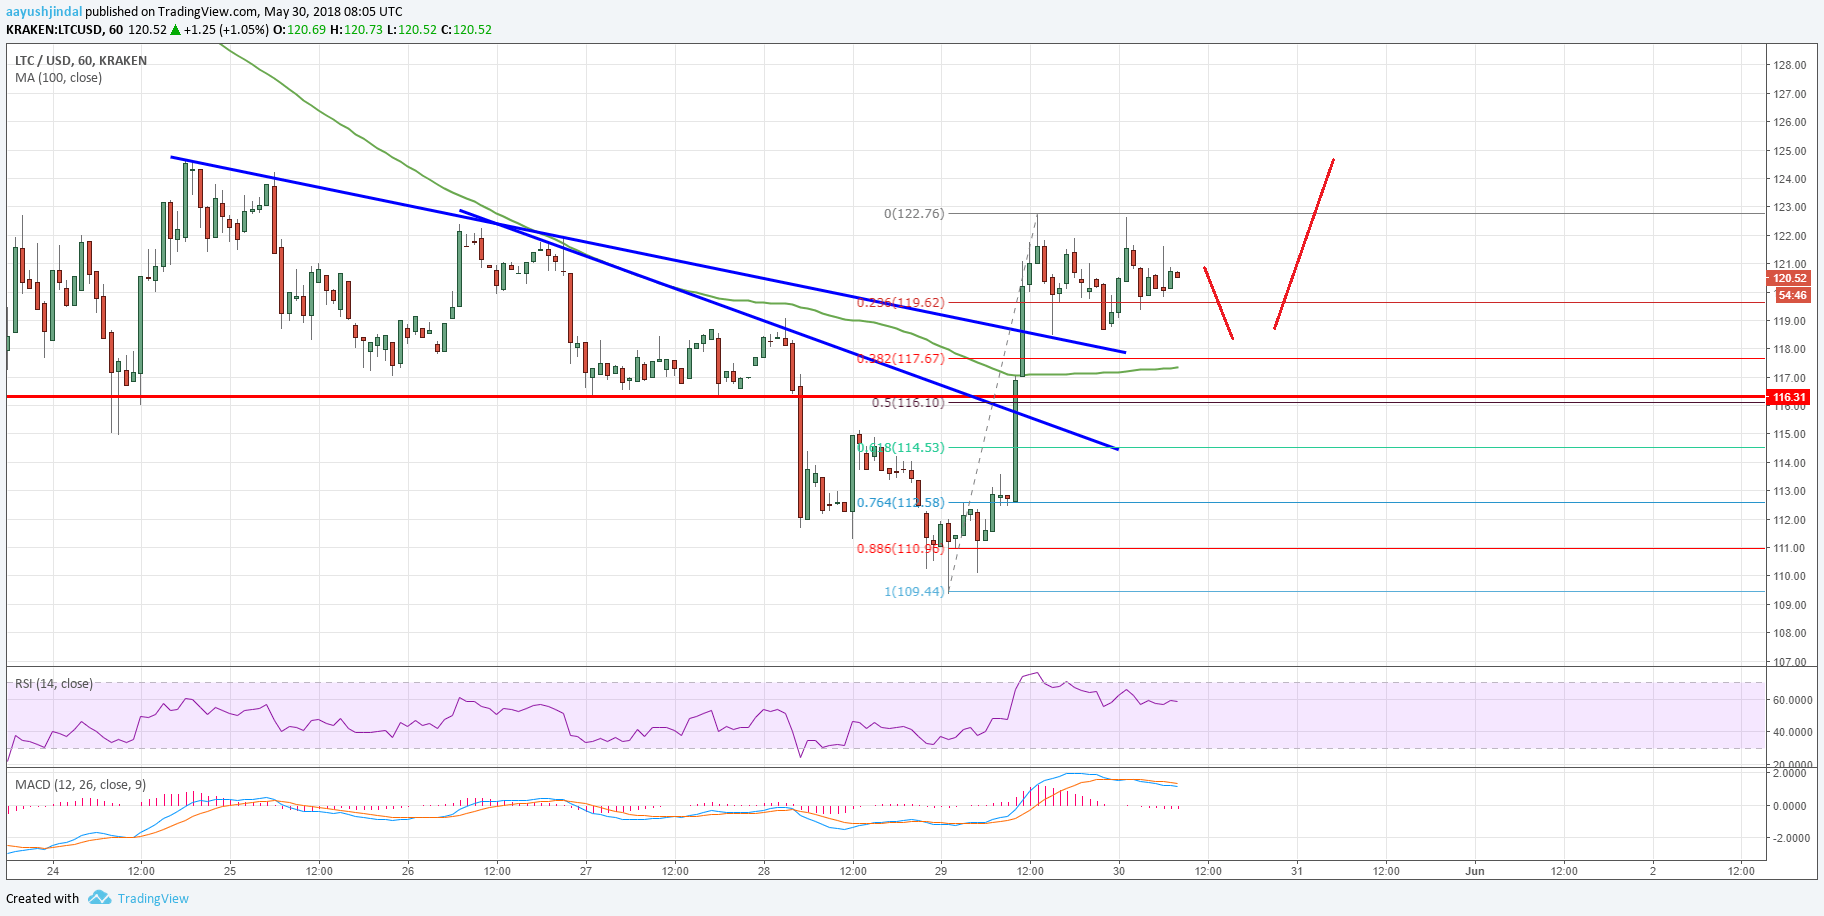
- There was a break above two important bearish trend lines with resistance near $114 and $118 on the hourly chart of the LTC/USD pair.
- The pair is currently trading near the $120 level and it could continue to move higher.
Litecoin Price Forecast
This week, we were looking for a test of the $100 handle in litecoin price against the US dollar. The LTC/USD pair did not test the $100 level and it seems like a solid support base was formed near the $110 level.
Looking at the chart, the price traded as low as $109.44 and started an upside move. It broke the 50% Fib retracement level of the last drop from the $122.10 high to $109.44 low, which opened the doors for more gains.
During the upside move, there was a break above a crucial hurdle near $115 and $116. Additionally, there was a break above two important bearish trend lines with resistance near $114 and $118 on the hourly chart of the LTC/USD pair.
It indicates that the price recent bounce from the $110 zone is real and there could be more gains in the near term. The pair traded as high as $122.76 and it is currently consolidating gains.
On the downside, an initial support is near the 23.6% Fib retracement level of the last wave from the $109.44 low to 122.76 high. However, the most important support is near the $116 level and the 100 hourly simple moving average.
Moreover, the previous hurdle at $115 may well act as a support if the price moves down from the current levels. On the upside, an immediate resistance is at $122.50, above which the price may perhaps trade towards $130.
The market data is provided by TradingView.


