Ethereum price stayed above the key 0.0314 support area against bitcoin and climbed above $170 versus the US Dollar. ETH to BTC is likely to extend gains above 0.0340 and 0.0342 resistance levels.
Key Talking Points
- Ethereum price is forming a strong support above the 0.0314 level against bitcoin.
- There is a crucial bearish trend line in place with resistance at 0.0330BTC on the 4-hours chart of the ETH/BTC pair (data feed from Poloniex).
- The pair is likely to break the trend line and it could even climb above 0.0340BTC.
Ethereum Price Chart Analysis
In the past few hours, there was a decent bounce in bitcoin, litecoin, Ethereum, EOS, bitcoin cash, ripple, and others against the US Dollar. ETH to BTC also recovered a few points after it formed a strong support base near the 0.0312 and 0.0314 levels.

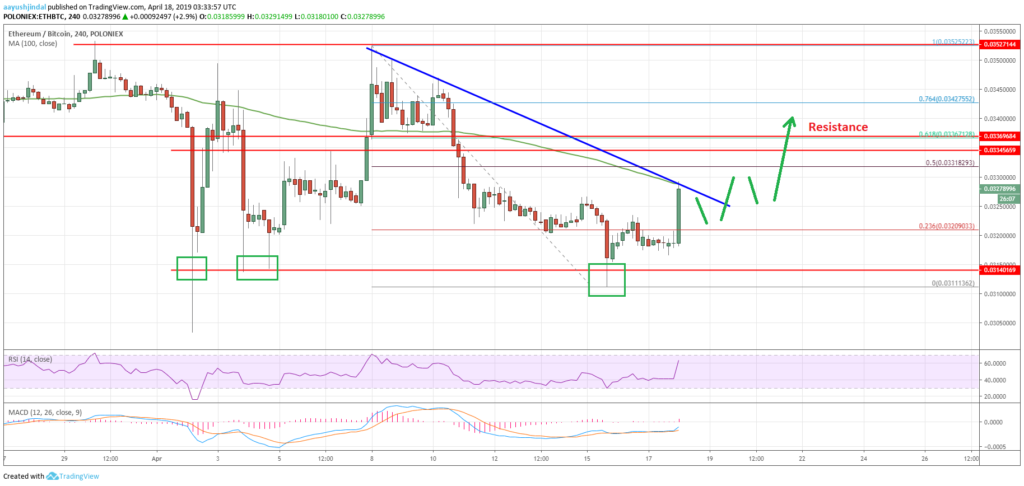
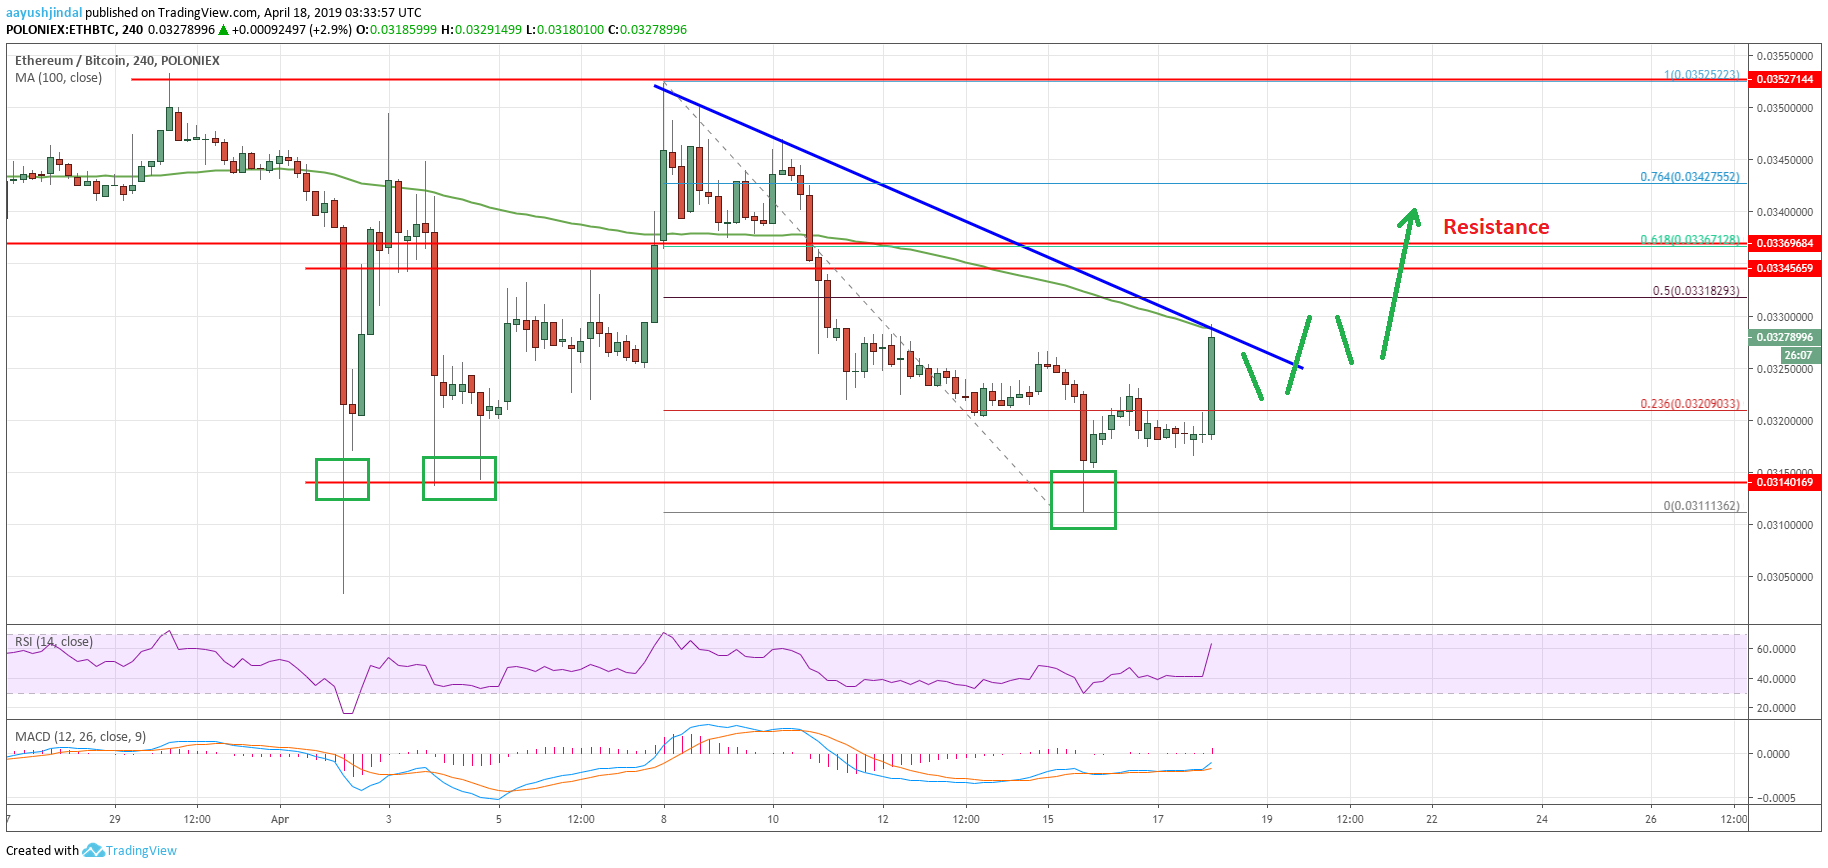
Looking at the chart, the price traded as low as 0.0311 and recently bounce back. It seems like there is a crucial support base formed near the 0.0312 and 0.0314 levels. Sellers made many attempts to push the price lower, but they failed.
Recently, the price bounced back above 0.0320BTC and the 23.6% Fib retracement level of the last decline from the 0.0352BTC high to 0.0311BTC low.
The price even spiked above the 0.0325BTC level and tested the next key resistance at 0.0330BTC and the 100 simple moving average (4-hours). There is also a crucial bearish trend line in place with resistance at 0.0330BTC on the 4-hours chart of the ETH/BTC pair.
Above the trend line, the 50% Fib retracement level of the last decline from the 0.0352BTC high to 0.0311BTC low at 0.0331BTC could act as a resistance. However, the main resistance is near 0.0335BTC and 0.0340BTC, where sellers are likely to emerge.
Above 0.0340BTC, the price could revisit the 0.0350BTC level. On the downside, the 0.0314BTC level remains a strong support for Ethereum price. Only a daily close below 0.0314BTC and 0.0312BTC could open the doors for more losses. The next key support is at 0.0300BTC, which is a significant buy zone.
The market data is provided by TradingView.

