Litecoin price made another attempt to clear the $120.00 resistance against the US dollar, but failed. LTC declined sharply and it is currently trading above the key $100.00 support.
Key Talking Points
- Litecoin price failed on two occasions near the key $120.00 resistance (Data feed of Kraken) against the US Dollar.
- There was a break below a major bullish trend line with support at $115.00 on the hourly chart.
- LTC price is currently trading above the $100.00 support and it could recover in the near term.
Litecoin Price Analysis (LTC)
Recently, there was a nasty declined in bitcoin, Ethereum, EOS, litecoin and ripple against the US Dollar. The LTC/USD pair struggled to clear the $120.00 level, resulting in a sharp drop below the $115.00 and $110.00 support levels.

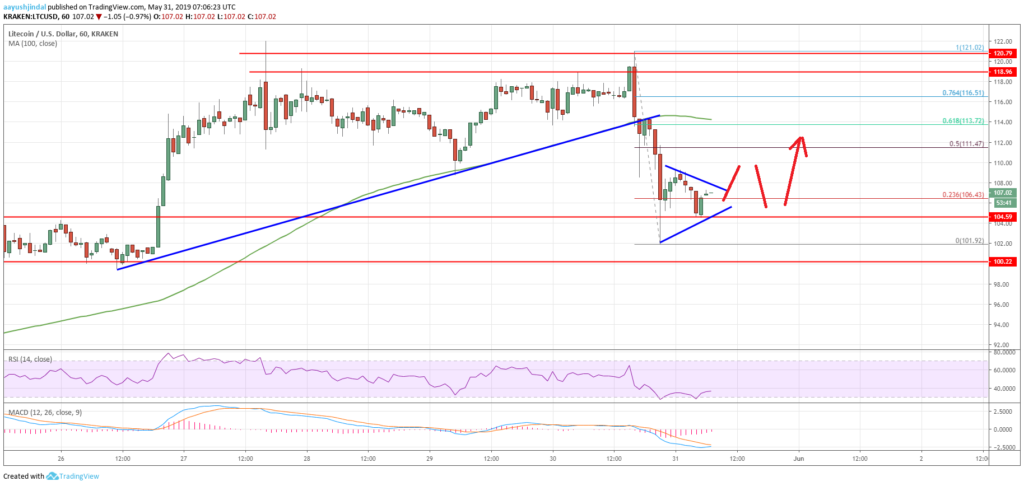
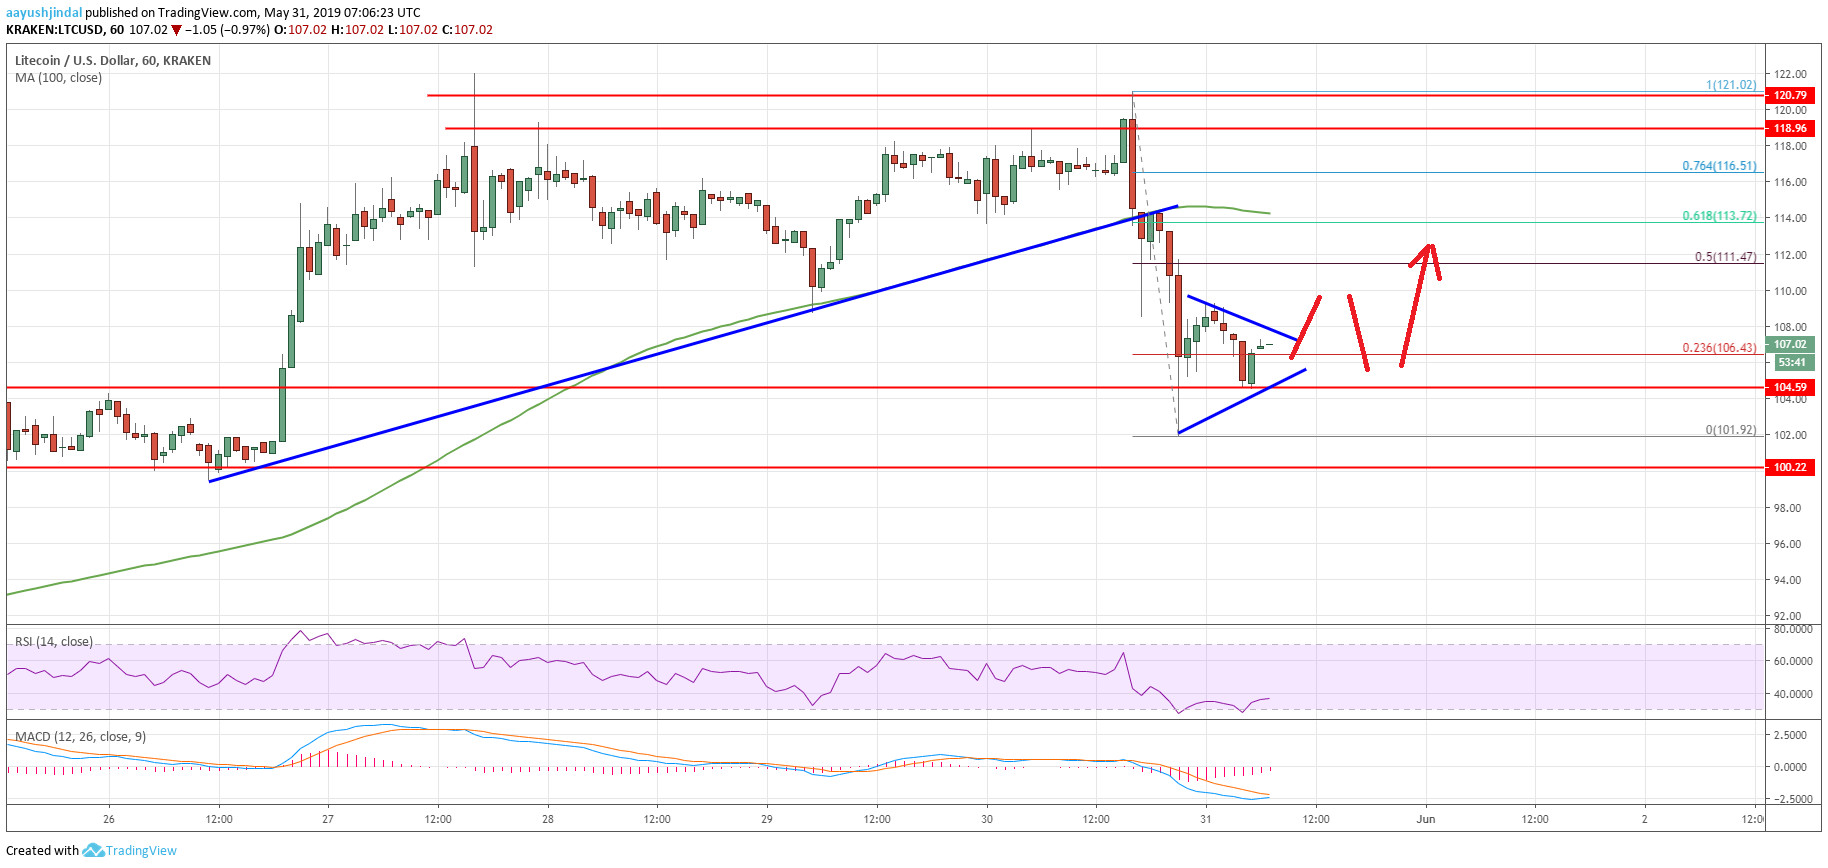
Looking at the chart, LTC price topped near the $121.02 level and recently declined below the $115.00 support level. There was even a close below the $110.00 level and the 100 hourly simple moving average.
Moreover, there was a break below a major bullish trend line with support at $115.00 on the hourly chart. The pair even broke the $108.00 level and traded as low as $101.92.
The price recovered above the $106.00 level and the 23.6% Fib retracement level of the recent drop from the $121.02 high to $101.92 low. In the short term, there could be range moves above $100.00 before the price recovers above $108.00.
The next key resistance is near the $111.50 level and the 100 hourly simple moving average. However, the previous support area near $115.00 is likely to act as a strong hurdle for the bulls.
On the downside, the main supports are $102.00 and $100.00. If there is a downside break below the $100.00 handle, the price could accelerate losses towards the $92.00 support.
The current price action is bearish, but litecoin price is likely to stay above the $100.00 support area. On the upside, an initial resistance is at $108.00, above which LTC is likely to recover towards the key $115.00 resistance area.
The market data is provided by TradingView.

