Litecoin price corrected lower recently and tested the $84.00 support against the US dollar. LTC is currently moving higher and it could surpass $100.00 in the near term.
Key Talking Points
- Litecoin price found a strong support near the $84.00 level and bounced back (Data feed of Kraken) against the US Dollar.
- There is a key bullish trend line forming with support at $88.80 on the 4-hour chart.
- LTC price remains well supported on the downside and it could soon break $98.00 and $100.00.
Litecoin Price Analysis (LTC)
This past week, there was a major downside correction in bitcoin, Ethereum, EOS, ripple and litecoin against the US dollar. The LTC/USD pair declined heavily below $100.00 and $90.00 before the bulls took a stand near the $84.00 support area.

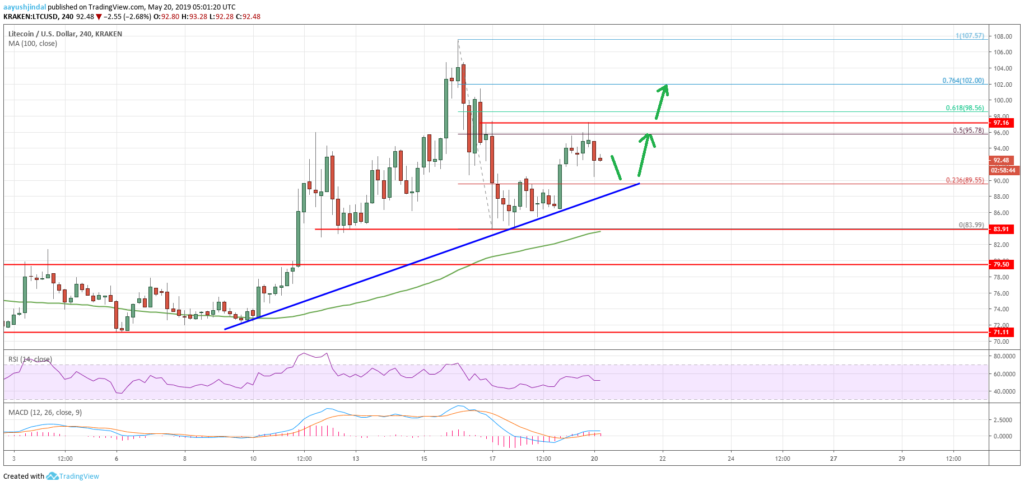
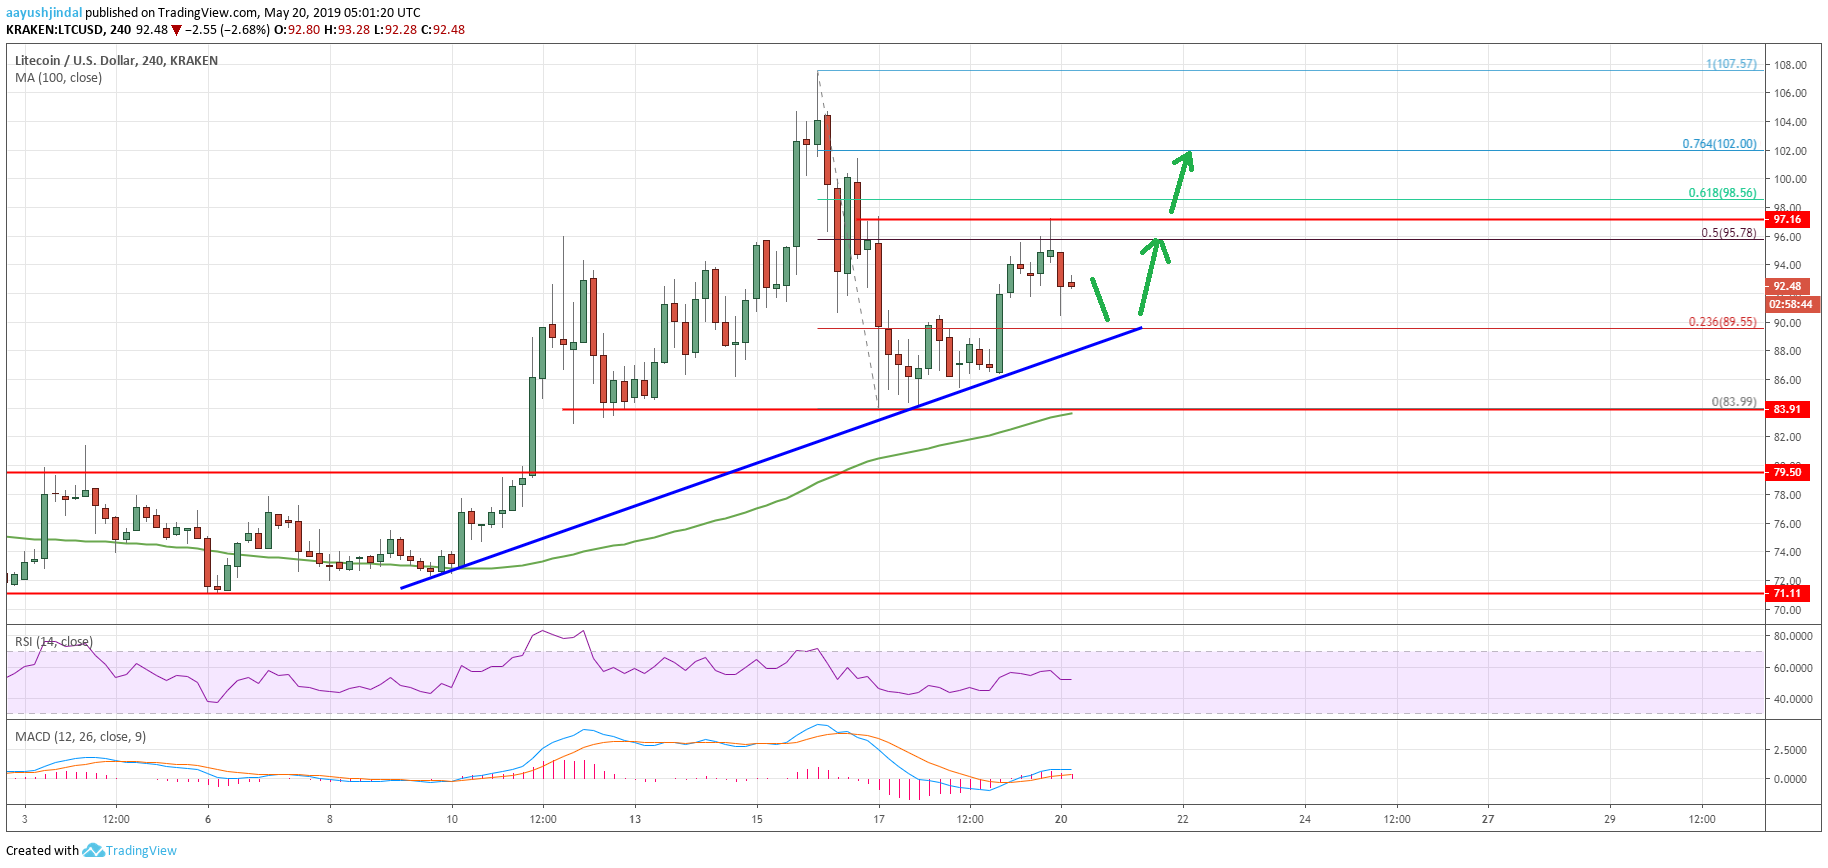
Looking at the 4-hour chart, LTC price traded as low as $83.99, but stayed well above the 100 simple moving average (4-hour). Recently, the price started a fresh increase above the $88.00 resistance and the 23.6% Fib retracement level of the last drop from the $107.57 high to $83.99 low.
The upward move was such that the price even broke the $92.00 and $94.00 resistance levels. It tested the next key resistance area near the $97.00 and $97.20 levels.
Besides, it tagged the 50% Fib retracement level of the last drop from the $107.57 high to $83.99 low. It is currently consolidating above the $89.00 and $88.00 support levels. There is also a key bullish trend line forming with support at $88.80 on the 4-hour chart.
If there is a downside break below the trend line, the pair could revisit the $84.00 support area. On the upside, an initial resistance is near the $97.20 level, above which the price could rally above $98.00 and $100.00.
The overall price action is positive, suggesting more gains in litecoin price above the $100.00 level. LTC could continue to climb and it might revisit the $105.00 and $107.00 levels. Only a daily close below the $84.00 support level may negate the current bullish view and push the price further lower.
The market data is provided by TradingView.

