Litecoin price extended gains and traded above the $52.00 resistance against the US dollar. LTC corrected lower, but it remains well supported above $47.50 for more gains.
Key Talking Points
- Litecoin price remained in the bullish zone and broke the $50.00 resistance (Data feed of Kraken) against the US Dollar.
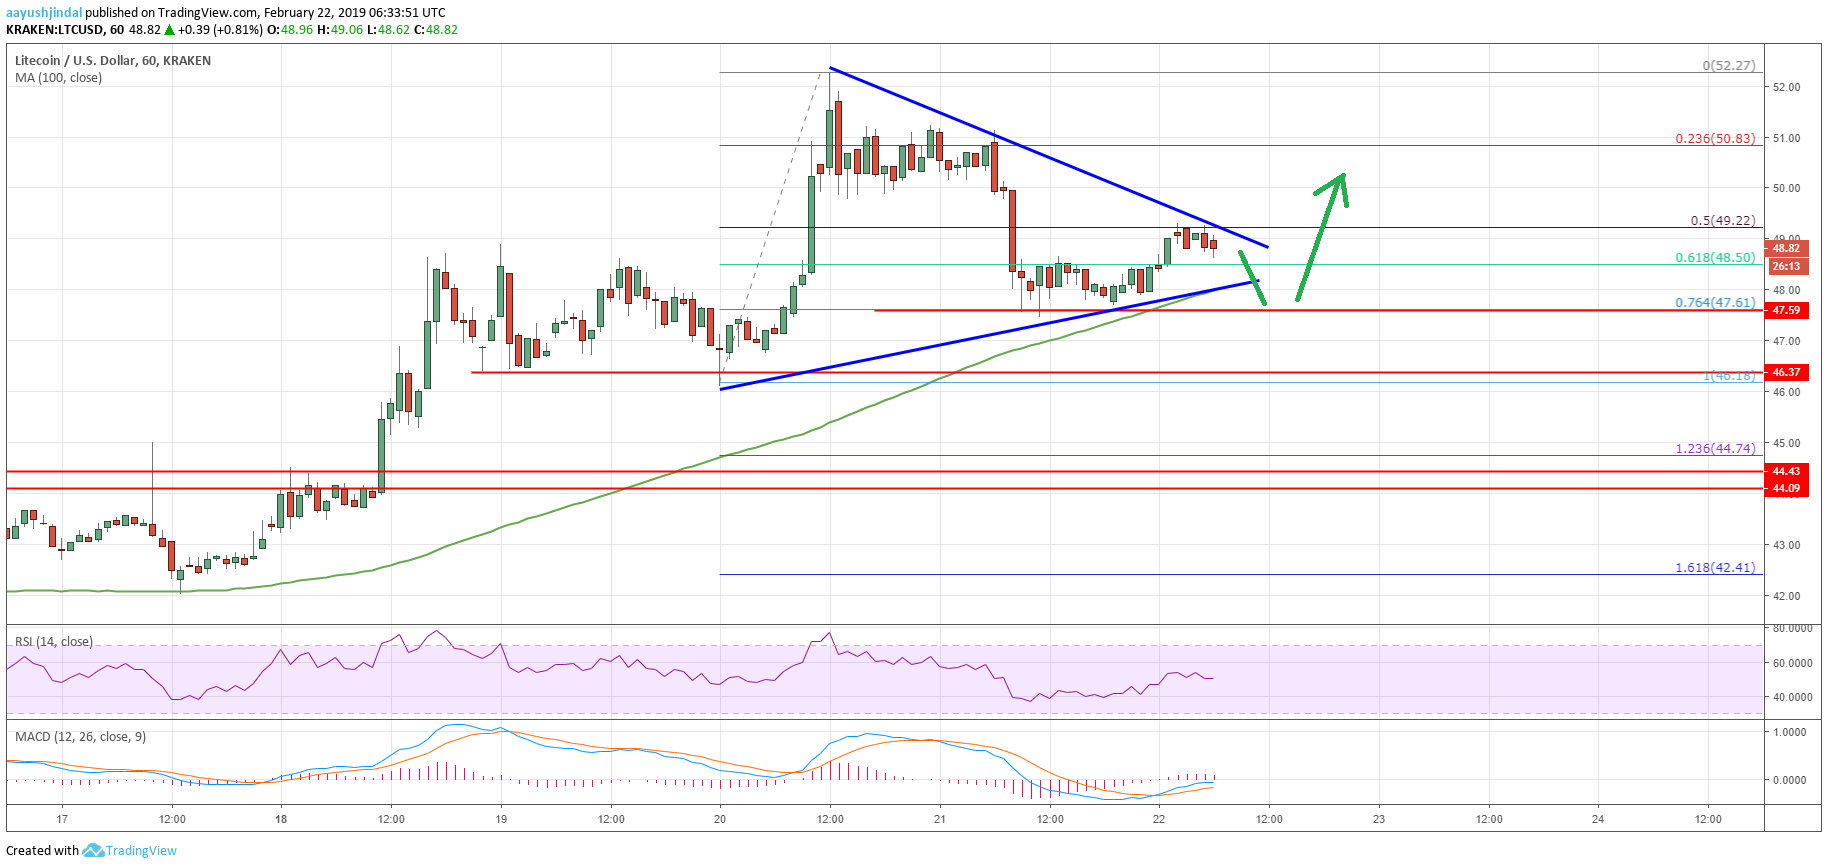
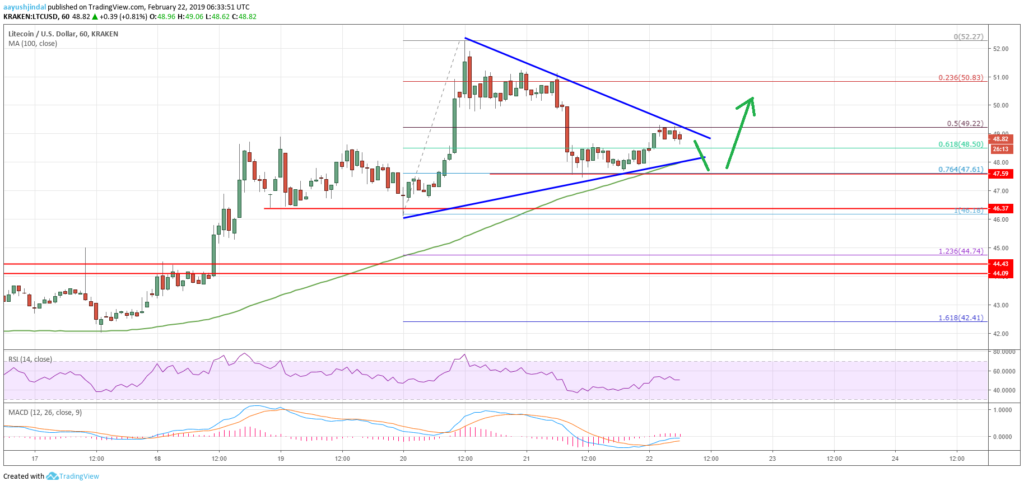
- There is a key contracting triangle formed with resistance at $49.10 on the hourly chart.
- LTC price is likely to resume its uptrend above the $50.00 and $52.00 resistance levels.
Litecoin Price Analysis (LTC)
Earlier this week, there was a sharp upward move from the $46.00 support area in litecoin price against the US dollar. The LTC/USD pair broke the $48.00 resistance area and even climbed above the key $50.00 resistance.
Looking at the chart, LTC price gained bullish momentum above the $50.00 resistance and the 100 hourly simple moving average. The price even broke the $52.00 resistance and a new monthly high at $52.27 was formed.
Later, the price started a downside correction and traded below the $50.00 support level. The price declined below the 50% Fib retracement level of the recent wave from the $46.18 low to $52.27 high.
There was even a break below the $48.00 level before buyers appeared near the $47.50 support. The 76.4% Fib retracement level of the recent wave from the $46.18 low to $52.27 high acted prevented declines below $47.50.
Moreover, the 100 hourly simple moving average acted as a strong support (currently above $47.80). The price bounced back and traded above the $48.50 level. At the outset, there is a key contracting triangle formed with resistance at $49.10 on the hourly chart.
It seems like litecoin price is preparing for the next key break either above the $49.00 resistance or below the $48.00 support. On the upside, a break above the $49.00 and $50.00 resistances could spark more gains. The next stop for LTC price could be $52.00 and $53.50. On the other hand, a downside break below the $48.00 support and the 100 SMA may perhaps start an extended correction towards the $45.00 support level.
The market data is provided by TradingView.


