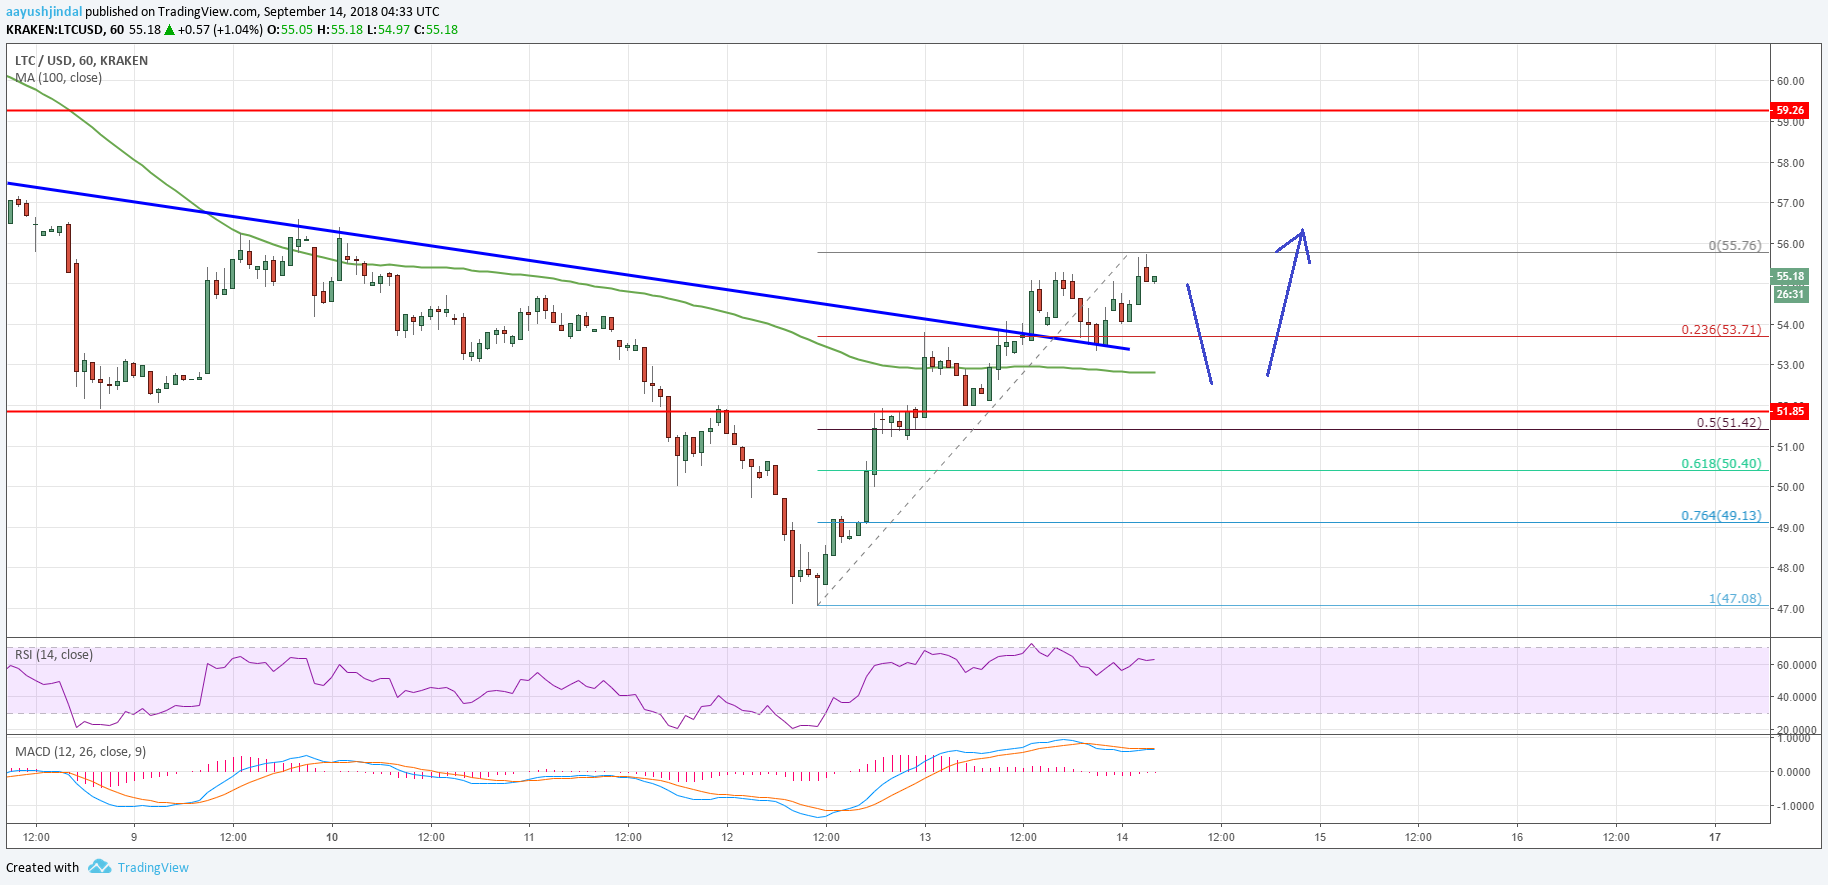
Litecoin price traded further higher and broke the $54.50 resistance against the US Dollar. LTC/USD may correct lower, but the broken resistance at $52.00 could hold losses.
Key Talking Points
- Litecoin price climbed further higher and managed to move above $54.00 and $55.00 (Data feed of Kraken) against the US Dollar.
- Yesterday’s highlighted important bearish trend line was breached with resistance at $53.70 on the hourly chart of the LTC/USD pair.
- LTC price is now placed nicely above the $52.00 support and the 100 hourly simple moving average.
Litecoin Price Forecast
Yesterday, we saw a decent recovery above the $51.00 resistance in litecoin price against the US dollar. The LTC/USD pair could have faded, but Ethereum price and ripple price recovery helped it to hold gains above $51.00.
Looking at the chart, LTC price climbed further higher and it managed to move above the $54.00 and $55.00 resistance levels. There was also a break above the 61.8% Fib retracement level of the last drop from the $56.55 high to $47.00 swing low.
During the rise, yesterday’s highlighted important bearish trend line was breached with resistance at $53.70 on the hourly chart of the LTC/USD pair. It opened the doors for more gains and the price settled above the $52.00 support and the 100 hourly simple moving average.
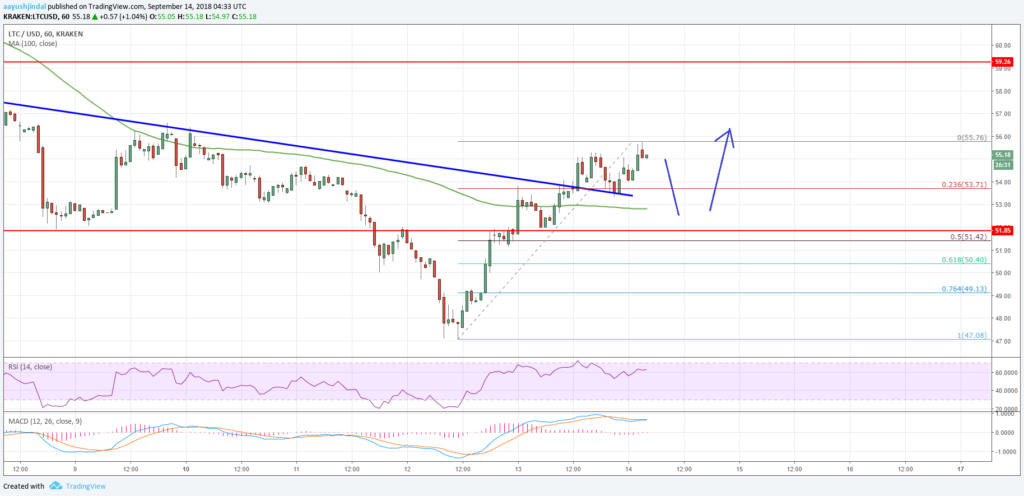
It traded as high as $55.76 and it is currently consolidating gains. An initial support on the downside is near the 23.6% Fib retracement level of the recent wave from the $47.08 low to $55.76 high.
Below the $53.70 support, the broken trend line and the 100 hourly SMA could act as a support zone. The most important support on the downside is near the $51.85 level, which was a resistance earlier. Moreover, the 50% Fib retracement level of the recent wave from the $47.08 low to $55.76 high is at $51.42 to act as a support.
As long as litecoin price is trading above the $51.50 support zone, it remains in a positive zone for a push towards the $57.00 and $59.00 levels. If not, it could dive back towards the $50.00 level.
The market data is provided by TradingView.


