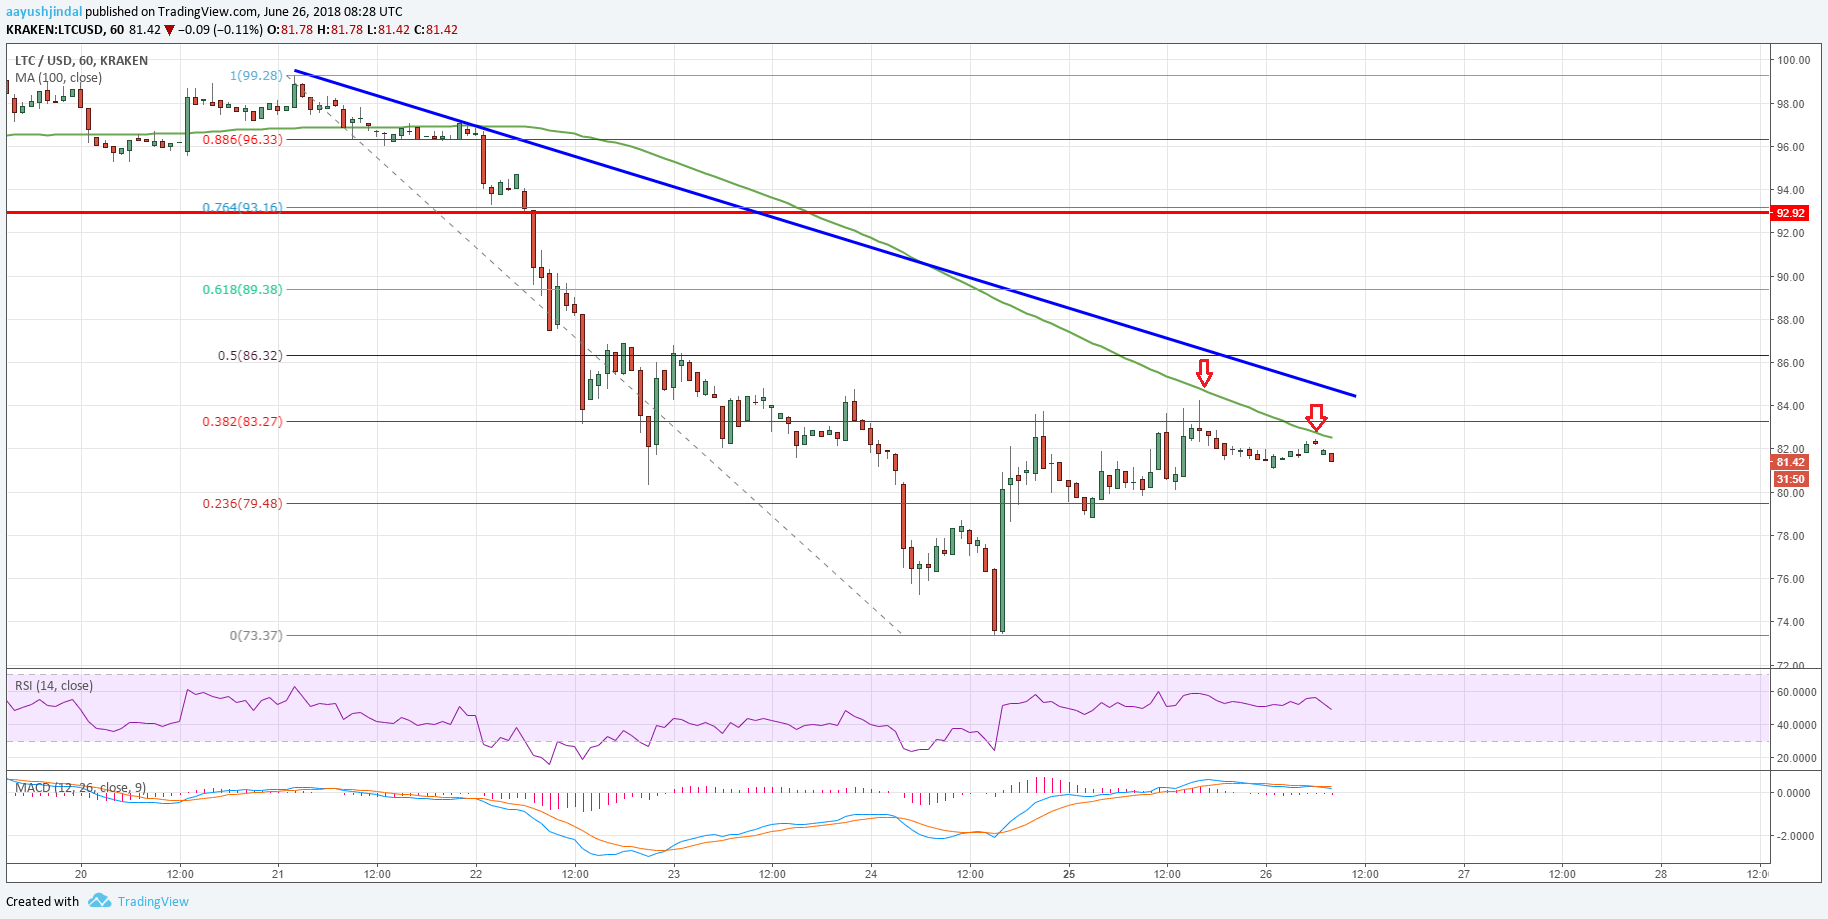
Litecoin price moved a few points above the $80 level against the US Dollar. LTC/USD failed to move past $84.00 and the 100 hourly simple moving average.
Key Talking Points
- Litecoin price tested the $85 resistance zone where it faced sellers (Data feed of Kraken) against the US Dollar.
- There is a major bearish trend line in place with resistances at $85 on the hourly chart of the LTC/USD pair.
- The pair must break the $85 resistance and the 100 hourly SMA to gain traction.
Litecoin Price Forecast
There was a minor upside move in litecoin price above the $75 level against the US dollar. The LTC/USD pair even traded above the $80 level and tested a crucial resistance zone near $84-85.
Looking at the chart, the price successfully settled above the $80 level, which is a positive sign. There was also a close above the 23.6% Fib retracement level of the last drop from the $100 swing high to $94 swing low.
However, the price failed to move above the $84-85 resistance zone, which acted as a barrier for buyers along with the 100 hourly simple moving average. The 38.2% Fib retracement level of the last drop from the $100 swing high to $94 swing low also prevented gains.
Moreover, there is a major bearish trend line in place with resistances at $85 on the hourly chart of the LTC/USD pair. Therefore, the pair has to move above the 100 hourly SMA, the $85 resistance, and the trend line to gain upside momentum.
Above $85, the next major resistance is around the $93 level, which was a support earlier. On the other hand, if the price fails to move above $85, there is a risk of a downside move below $80.
The next supports below $80 are at $76 and $74. The overall price action is stable as long as the price is above $80. However, a break above $85 is needed to overcome the current bearish pressure.
The market data is provided by TradingView.


