Litecoin price declined towards $115 before it found support against the US Dollar. LTC/USD recovered, but it faced a strong resistance near $124.
Key Talking Points
- Litecoin price started an upside correction after testing the $115 support zone (Data feed of Kraken) against the US Dollar.
- Yesterday’s highlighted important bearish trend line with current resistance at $122 acted as a strong hurdle on the hourly chart of the LTC/USD pair.
- The pair is struggling to move above the $122 and $124 resistance levels.
Litecoin Price Forecast
There were further declines below $120 in litecoin price against the US dollar. The LTC/USD pair declined towards the $115 level where buyers appeared and protected losses.
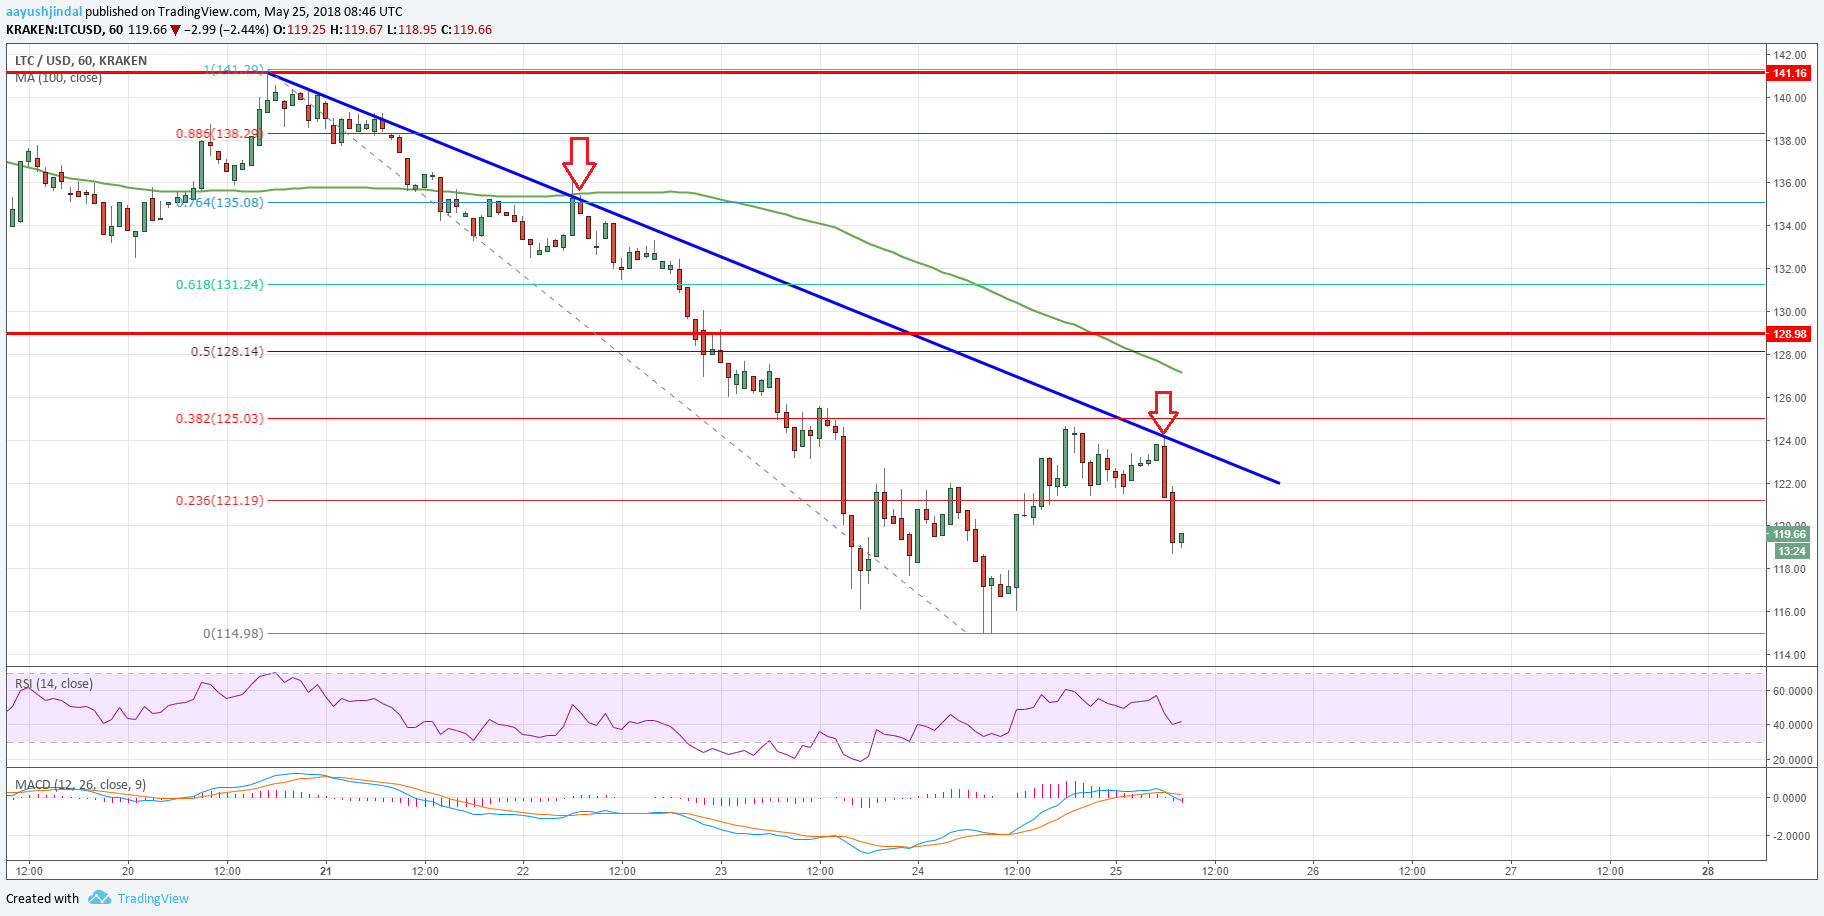
Looking at the chart, the price formed a decent base at $114.98 and started an upside move. It traded higher with a positive bias and broke the $120 resistance level.
During the upside move, there was a break above the 23.6% Fib retracement level of the last decline from the $141.29 high to $114.98 low. However, the upside move faced a very strong resistance near $124.125.
More importantly, yesterday’s highlighted important bearish trend line with current resistance at $122 acted as a strong hurdle on the hourly chart of the LTC/USD pair. The pair failed to move above the $124 resistance and is currently trading lower.
The pair also failed to test the 38.2% Fib retracement level of the last decline from the $141.29 high to $114.98 low. Looking at the current price action, litecoin could make another attempt to break the trend line.
If buyers succeed, the price may perhaps move above $124 and trade towards $130 and the 100 hourly simple moving average. On the flip side, if the price fails to move above $122 and $124, it will most likely retest the $115 support.
Below the mentioned $115 support, LTC/USD may well trade below the $110 level and it could even test the $100 handle in the near term.
The market data is provided by TradingView.


