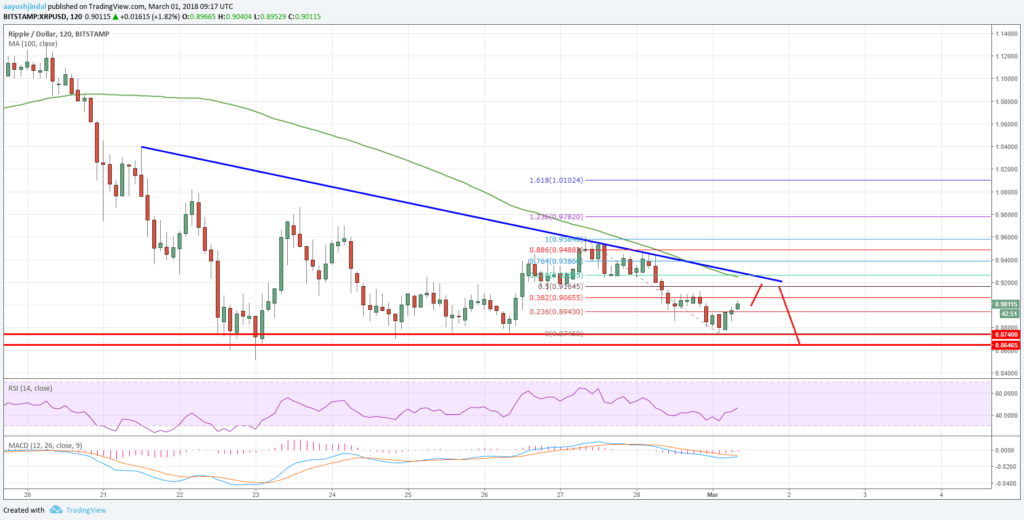
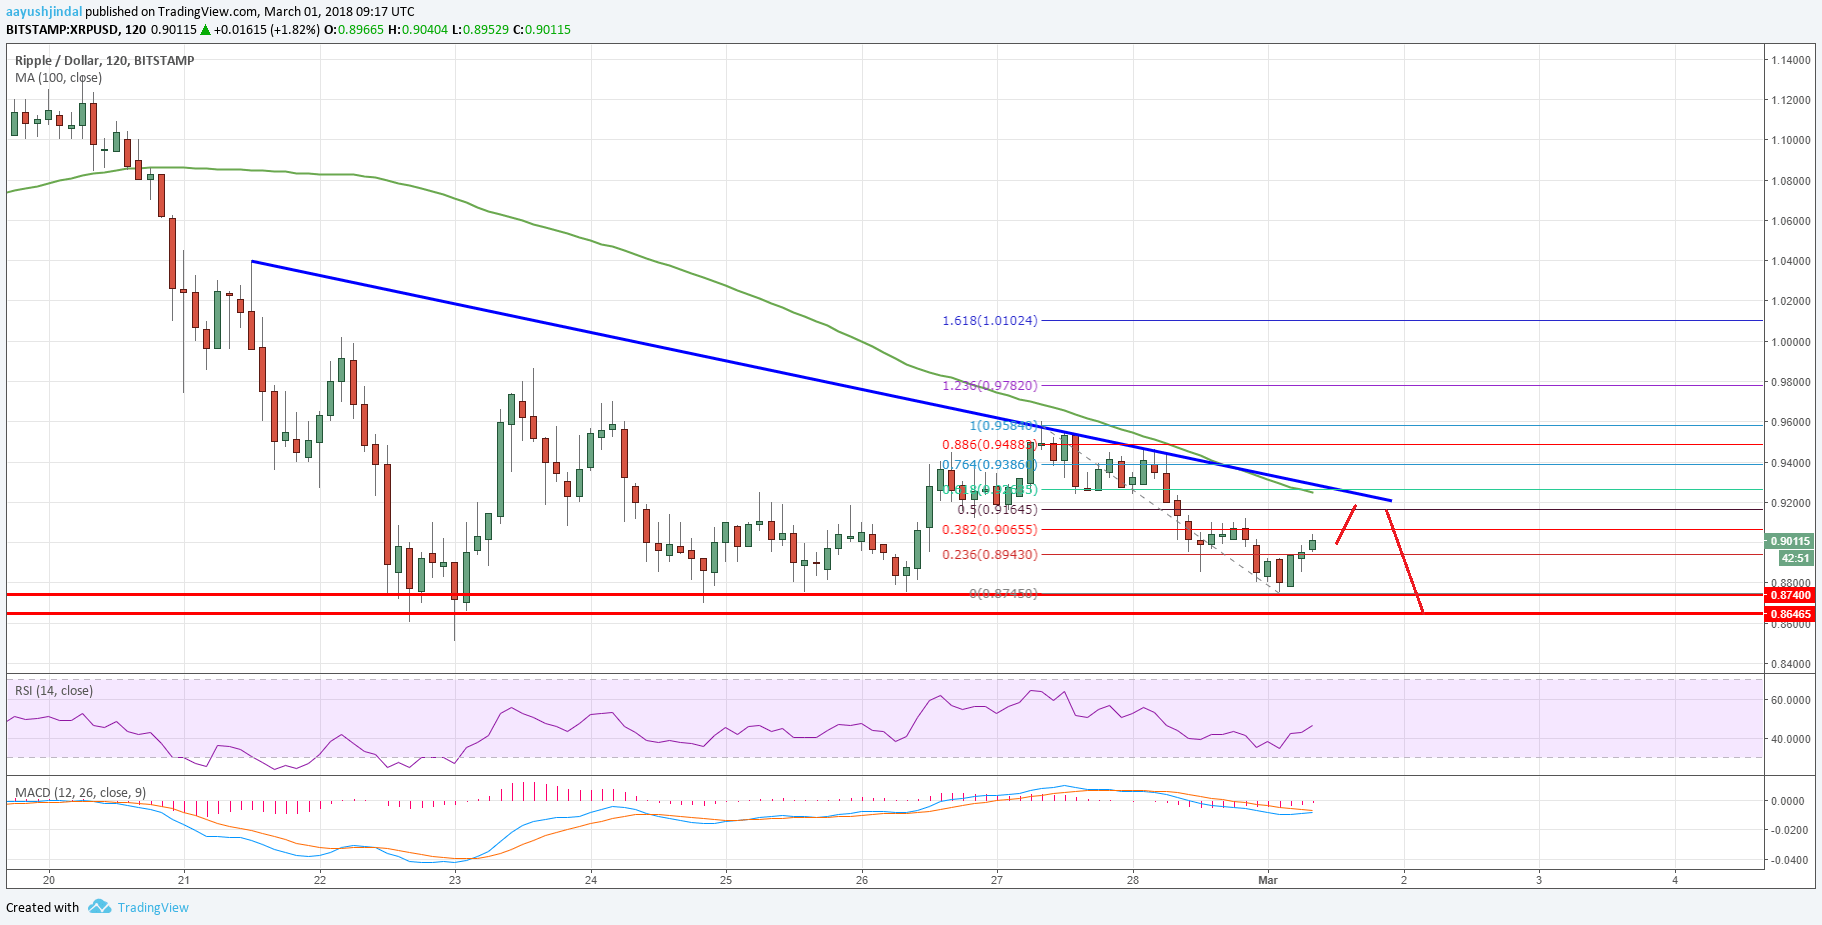
Ripple price is currently under pressure below the $0.9600 pivot against the US Dollar. XRP/USD may continue to decline and it remains sell near $0.9250.
Key Talking Points
- Ripple price declined recently and tested the $0.8740 support level against the US Dollar.
- There is a crucial bearish trend line forming with current resistance at $0.9200 on the 2-hours chart of the XRP/USD pair (Data feed via Bitstamp).
- The pair may decline one more time and it remains sell on rallies near $0.9200.
Ripple Price Forecast
There were mostly bearish moves in Ripple price below the $0.9600 pivot level against the US Dollar. The XRP/USD pair declined recently and broke the $0.9200 and $0.9000 support levels.

The decline was solid and the price settled below $0.9200 and the 100 simple moving average (2-hours). However, the downside move was protected by the $0.8740 support area, which prevented declines on many occasions earlier.
A low was formed at $0.8745 and the price is currently correcting higher. It has moved above the 23.6% Fib retracement level of the last decline from the $0.9584 high to $0.8745 low.
However, there are many barriers on the upside for XRP buyers near $0.9200. There is also a crucial bearish trend line forming with current resistance at $0.9200 on the 2-hours chart of the XRP/USD pair.
Moreover, the trend line resistance is close to the 50% Fib retracement level of the last decline from the $0.9584 high to $0.8745 low. The mentioned $0.9200 resistance is also near the 100 simple moving average (2-hours).
Therefore, it won’t be easy for the price to move above $0.9200. A successful 2-hour close above the $0.9200 resistance and the simple moving average (2-hours) could clear the path for more gains in the near term.
The next major resistance above $0.9200 is $0.9600. On the downside, the $0.8740 level is a monster support. The price has to stay above $0.8740 to avoid further declines. Below $0.8740, the price may slide towards $0.8000.
Trade safe traders and do not overtrade!

