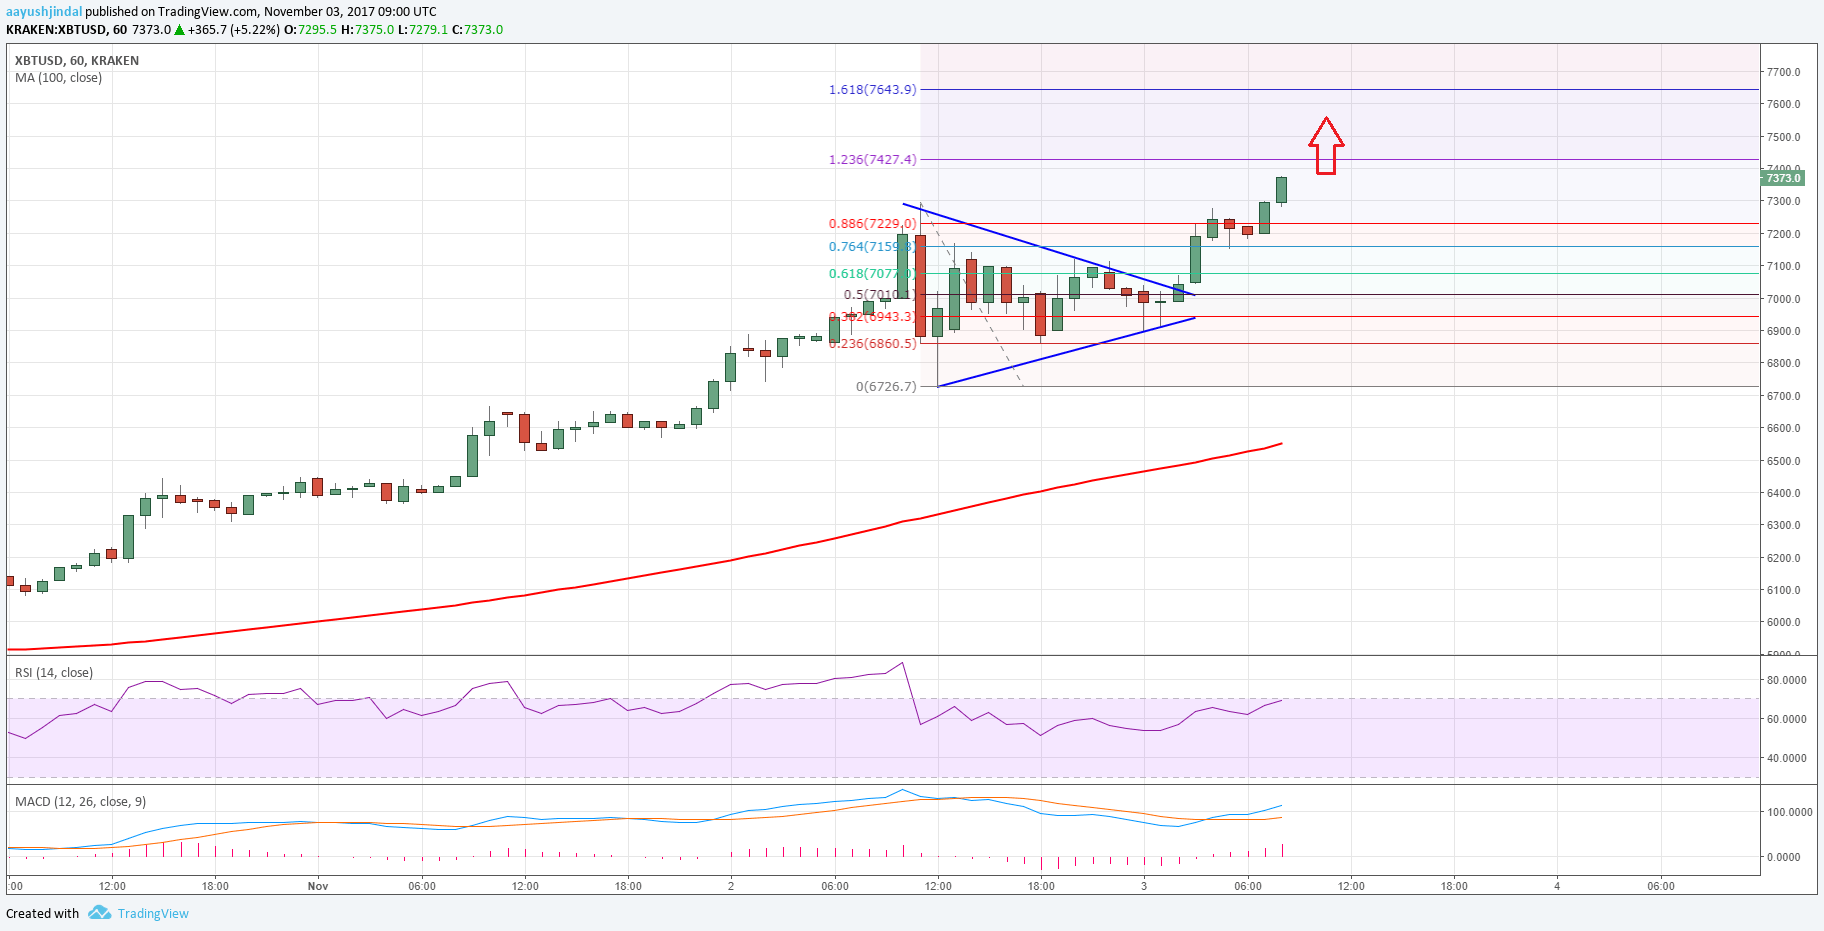
Bitcoin price is surging higher and recently traded to $7370 against the US Dollar. BTC/USD now looks set for a test of the $7640 level.
Key Talking Points
- Bitcoin price continued to move higher and recently traded to a new all-time high at $7370 (data feed by Kraken) against the US Dollar.
- There was a break above a contracting triangle pattern with resistance at $7000 on the hourly chart of BTC/USD.
- The mentioned break has opened the doors for more gains above the $7500 level towards $7640.
Bitcoin Price Chart Analysis
It seems like BTC buyers are not willing to give up as bitcoin price rocketed above the $7200 level against the US Dollar. Today, a new all-time high was formed at $7370 and there are no signs of any correction in the near term.
It is important to note there was a correction from the $7300 level once and the price traded back towards the $6700 support. A base was formed above $6700 and the price started a new rally. It moved above the $7000 handle and cleared the 50% Fibonacci retracement level of the last drop from the $7300 high to $6726 low.

Moreover, there was a break above a contracting triangle pattern with resistance at $7000 on the hourly chart of BTC/USD. It gave an opening to buyers to push the price above the last swing high at $7300.
The pair is now placed well above the last swing high of $7300, which could push it towards the 1.236 Fib extension of the last drop from the $7300 high to $6726 low at $7427.
However, the next target seems to be the 1.618 Fib extension of the last drop from the $7300 high to $6726 low at $7643. There can be tiny corrections in the short term, but as long as the price is above $7000, it could head towards $7640.
The overall trend is bullish and there are high chances of the current trend to continue unless a major bearish signal emerges.
Trade safe traders and do not overtrade!

