In brief:
- The price of US Crude oil fell hard to $0 with its futures contracts going as far down as $-40.
- The once in a lifetime event, shook the crypto markets with Bitcoin (BTC) going back below $7,000.
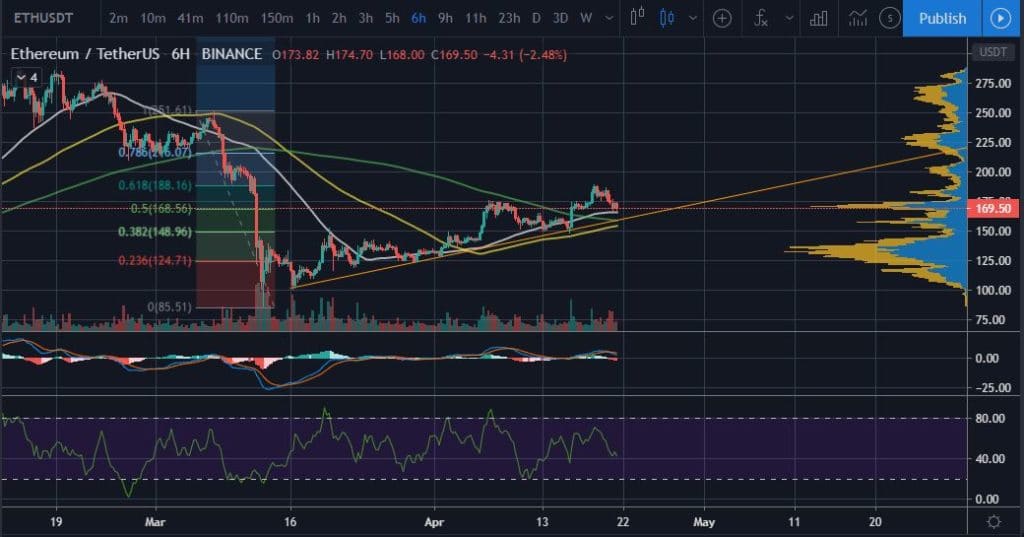
- At the time of writing this, the price of Ethereum (ETH) is holding the $168 support zone.
Analysts across the world have constantly been calling for a recession but no one was prepared for yesterday’s (April 20th) price action of US Crude Oil. The commodity fell hard to $0 per barrel with its futures contracts going down to negative territory. In the case of the latter, futures on US Crude Oil were at one point trading at $-40. However, and at the time of writing this, US Oil is currently trading at around $16.6 per barrel and $16.90 for its futures contracts. The aforementioned chaos did its fair share of damage to the price of Ethereum (ETH) as shall be elaborated.
Ethereum’s $168 Support Zone Holding Well
In one of our previous analysis of ETH/USDT, we had noted that the price of Ethereum was back in bullish territory. We had cited two reasons as to why this was so: Bitcoin’s dwindling dominance in the crypto markets and the prospects of ETH 2.0 launching later on this year. We had also identified $168 as a very strong support zone for the King of Smart contracts.
Revisiting our favorite ETH/USDT chart, we observe the following. In terms of lower time frame support zones, Ethereum has the following:
- $168
- $164
- $162
- $154
- $150
- $148
Ethereum’s current price at $170 is above the 50, 100 and 200 Moving averages thus providing one reason to still be optimistic that $200 is achievable.
However, the MACD has crossed in a bearish manner and the MFI also indicates that ETH/USDT is on course to retest some of the support zones identified above. Additionally, trade volume seems to be reducing in tandem with the rest of the cryptocurrencies in the markets including Bitcoin.
ETH 2.0 Progress
The Ethereum 2.0 testnet was successfully launched on the 18th of this month and has almost 20,000 validators in the few days that it has been active. The Mainnet launch is still on course to happen in July of this year.
Conclusion
On 20th April, we witnessed a history meltdown of the American crude oil prices as suppliers ran out of space of storing the commodity due to decreased demand. This is as a result of the global impact of COVID19. This meltdown affected both Bitcoin (BTC), Ethereum (ETH) and the majority of the cryptocurrencies in the markets. In the case of ETH, the coin is still holding the $168 support zone despite the oil crash. With the ETH 2.0 launch only days away, the coin might just live up to expectations of reclaiming $200. However, as with all Technical analysis, investors and traders are advised to use adequate stop losses to protect their trading capital.
(Feature image courtesy of Victor Freitas on Unsplash.com.)
Disclaimer: This article is not meant to give financial advice. Any additional opinion herein is purely the author’s and does not represent the opinion of Ethereum World News or any of its other writers. Please carry out your own research before investing in any of the numerous cryptocurrencies available. Thank you.


