Latest Bitcoin News
The truth is that South Korea is famous for cryptocurrency and the opportunities presented by digital assets are like no other. Not only are they global but they can be an escape for stagnating local economy and hopeless politics. Demand for Bitcoin and other assets was so high that the Kimchi Premium soared to 50 percent presenting an opportunity to arbitrage traders to reap more profits from a market that was closing on at the $1 trillion valuations. It is for these few reasons why cryptocurrencies including Bitcoin is gaining traction.
The rapid rise of prices last year did thrust Bitcoin and the underlying technology to the public, and since then the trajectory has been upwards. Governments are particularly interested in blockchain as one of the most revolutionary technology in the 21st century, and although there is a bit of resistance toward specific coins, their digital, global and privacy-centric nature make them a necessity in coming years.
This is how the world adopts a new kind of ATMs – the ones that sell crypto. pic.twitter.com/qD1tIFNYsp
— DataLight (@DataLightMe) December 19, 2018
They are still volatile, but increasing use and institutional interest have made them more liquid, and stability is low–at some point, it was lower than some of FANG stocks as NetFlix. Still, we expect volatility to further taper as the number of Bitcoin ATMs (BATMs) increase across Europe, Asia, and the US. According to Statista, the number of ATMs swelled from around 500 in 2016 to just over 4,000 by Dec 2018.
Bitcoin (BTC/USD) Price Analysis
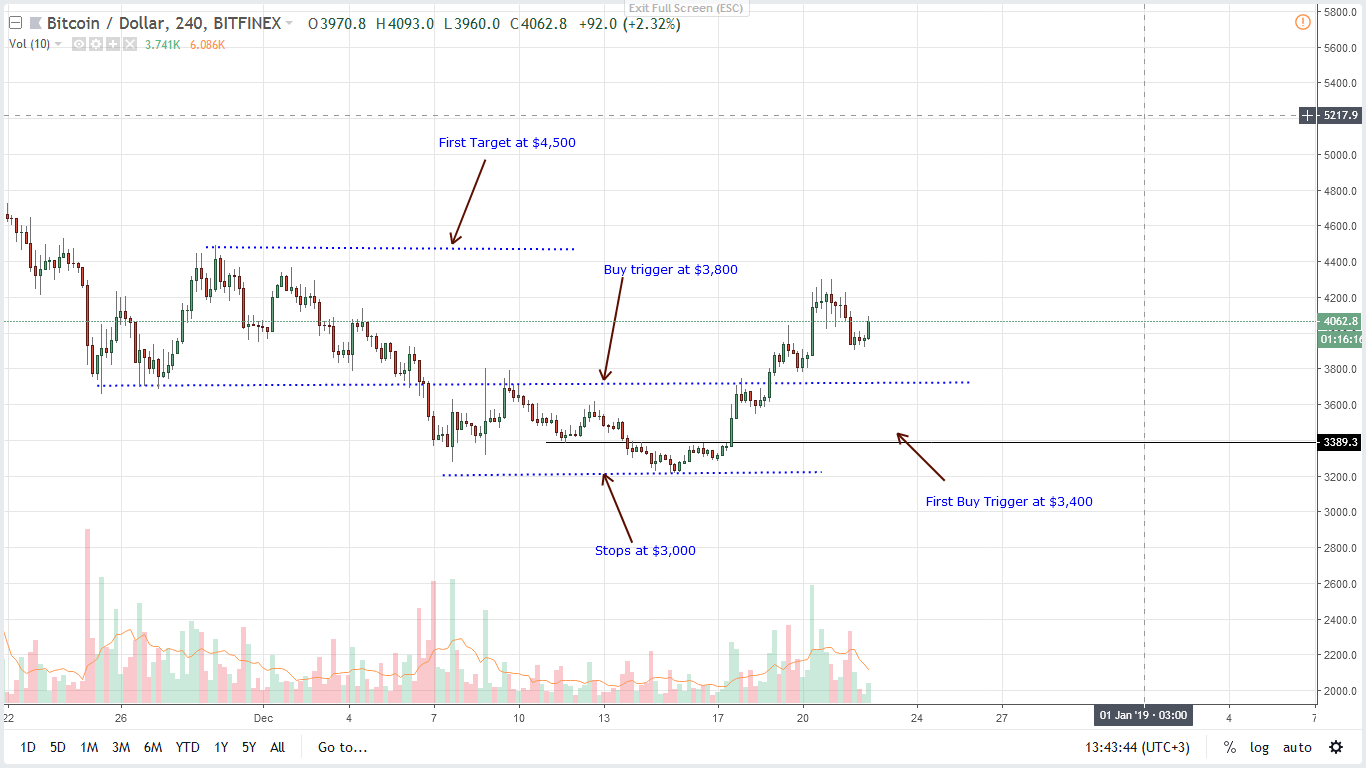
Bitcoin might be down 4.2 percent in the last day but on weekly time frame prices are up 19.1 percent at press time. If anything, this is positive. However, it would be boosting if prices surged past $4,000 and maintained at that level by Sunday. That is the impetus for the market to expand above $4,500 opening doors for $5,000 and even $6,000 by Jan 2019.
Trend and Candlestick Formation: Bearish, Minor Bullish Breakout
From a top-down approach, BTC is bearish against the USD with some commentators calling this a Zombie Rally–because participants are “dead”. Their doubt is technical. If BTC fails to break above $4,500 by the end of the year, the bear trend of last year might continue with liquidation causing BTC prices to tank below $3,200 and even $3,000. On the flip side, the minor bullish break above $3,800 and $4,000 could provide an opportunity for traders looking to enter on every dip. We shall consider these lower lows as a pullback, and BTC should be loading up on every retrace with ideal buying zone between $3,800 and $4,000.
Volumes: Increasing, Bullish
From an effort versus result point of view, Dec 20, 1100 HRs bull bar is vital for our analysis. Volumes were above average–21k versus 9k and at the moment, we expect Dec 20 lows at $3,860 to provide support. If prices dip below it at the back of high volumes, then BTC might melt towards $3,500 or lower. On the reverse side, gains above Dec 20 highs shall trigger long at $4,200, and BTC would easily test $4,500 in the first week of Jan.
Conclusion
From above, our BTC/USD trade plan is as follows:
Buy: $3,800–$4,000
Stop: $3,500
Target: $4,500, $5,000
Or,
Buy: $4,200
Stop: $4,000
Target: $4,500, $5,000
All Charts Courtesy of Trading View.
This is not Investment Advice. Do your Research.


