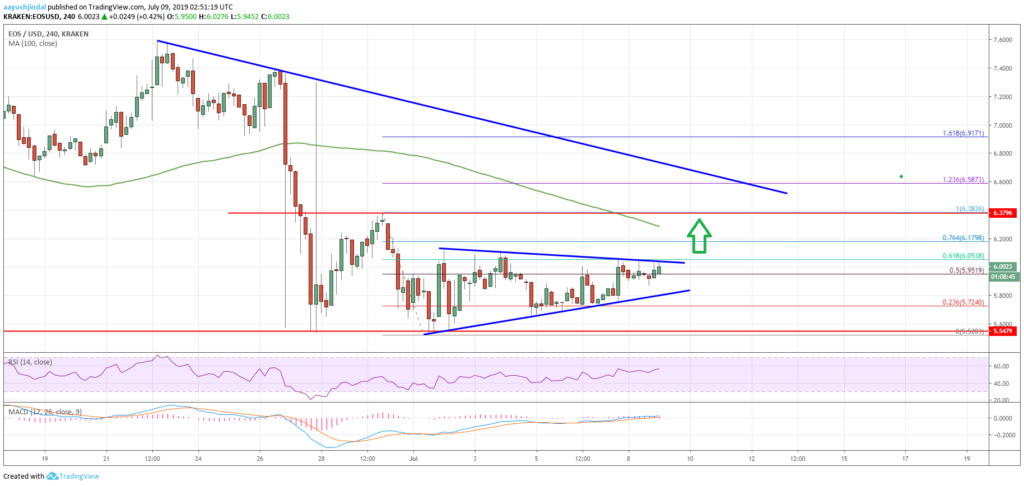
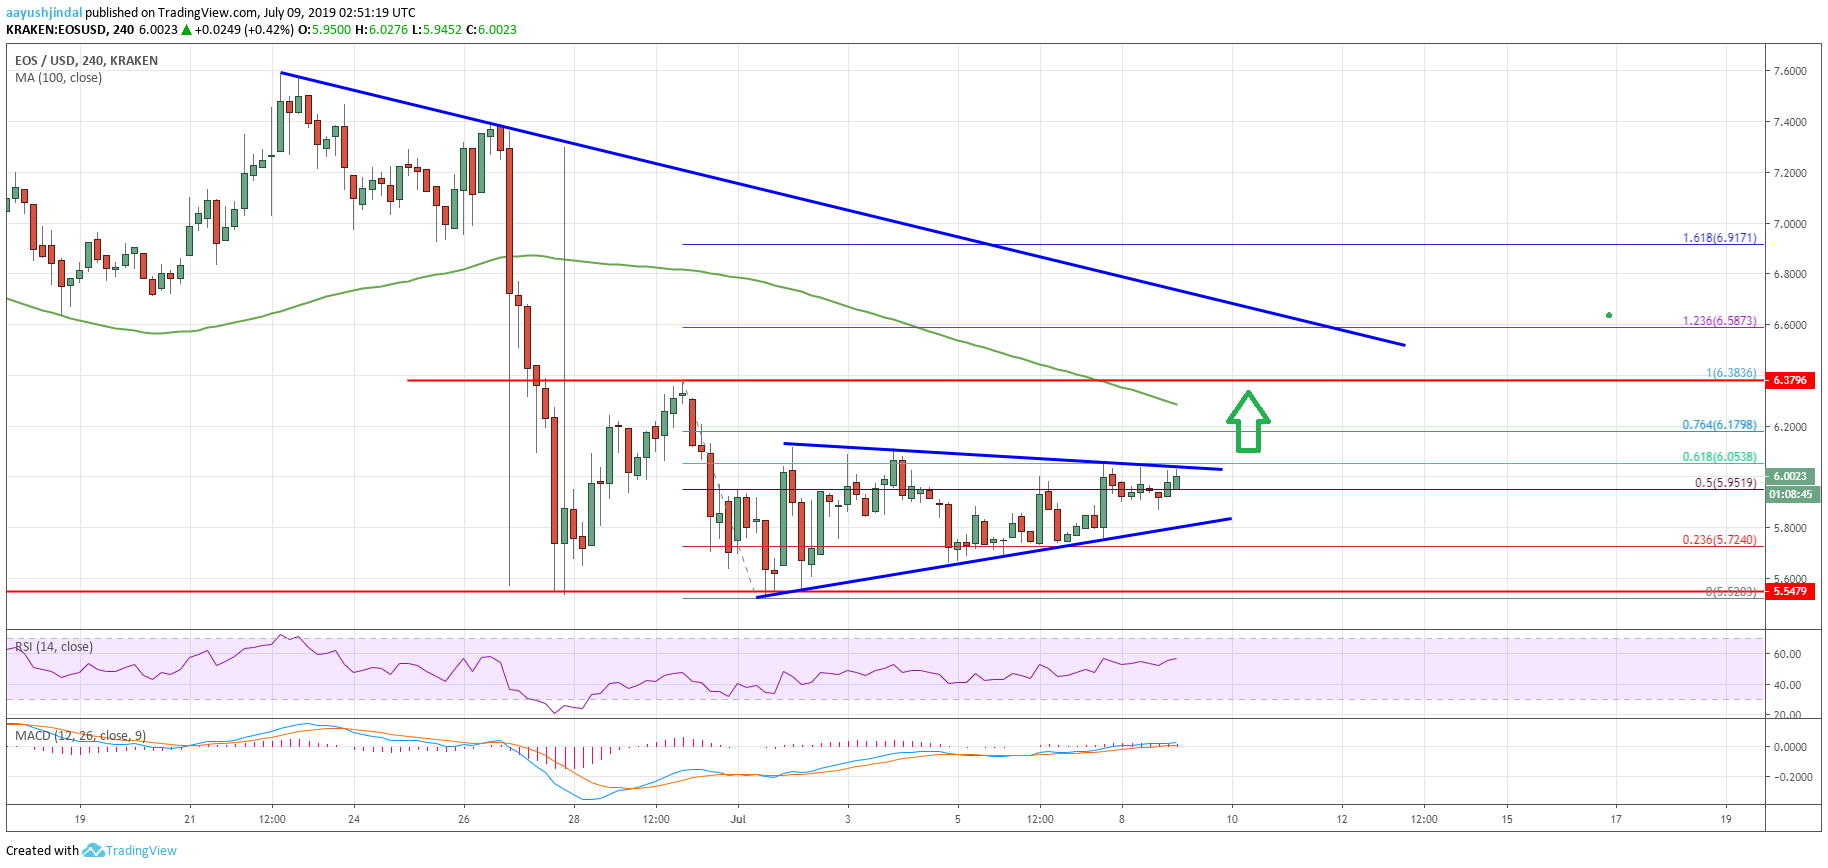
EOS price formed a decent support base above $5.700 and $5.800. EOS seems to be eyeing a strong upward move above $6.100, while bitcoin, ETH, XRP and litecoin are currently rising steadily.
Key Talking Points
- EOS price is showing a lot of positive signs above the $5.800 support area (Data feed of Kraken) against the US Dollar.
- There is a major breakout pattern forming with resistance near $6.050 on the 4-hours chart.
- The price is likely to break the $6.050 and $6.100 resistance levels to start an upward move.
EOS Price Analysis
After a sharp decline, EOS price found support near the $5.520 level. Recently, it started a steady rise above the $5.800 resistance. Besides, there were decent gains noted in bitcoin, EOS, Ethereum and litecoin against the US Dollar.

The chart above indicates that EOS price formed a decent support base above $5.700 and $5.800, but it is still well below the 100 simple moving average (4-hours).
The price settled above the $5.800 level and the 50% Fib retracement level of the last slide from the $6.383 high to $5.520 low. However, the price is facing a strong resistance near the $6.050 and $6.080 levels.
Moreover, there is a major breakout pattern forming with resistance near $6.050 on the 4-hours chart. The 61.8% Fib retracement level of the last slide from the $6.383 high to $5.520 low is also acting as a resistance.
If there is an upside break above the $6.050 and $6.080 resistance levels, the price could climb further higher. The next key resistance is near the $6.250 level and the 100 simple moving average (4-hours).
Above the 100 simple moving average (4-hours), the next major resistance is near the $6.600 level and a connecting bearish trend line on the same chart. On the downside, there are many supports forming near the $5.800 level, below which the price could revisit $5.500.
Overall, EOS price seems to be preparing for the next key break above the $6.050 and $6.080 resistance levels. If it fails to climb higher, it could decline again towards $5.500.
The market data is provided by TradingView.

