Latest Ethereum News
There are three main pieces of infrastructure that supports the Ethereum Ecosystem: Truffle, Infura and MetaMask. Truffle is a “A world-class development environment, testing framework and asset pipeline for blockchains using the Ethereum Virtual Machine (EVM), aiming to make life as a developer easier” while Infura is an “API and developer tools providing the necessary infrastructure and scaling capabilities for dApps”.
On the other hand, MetaMask is an Ether and ERC-20 wallet that runs on Infura. Aside from securing your coins private keys, it also acts a bridge for dApp exploration right off your browser. It also allows users to run dApps without the need of downloading the whole Ethereum full node.
Market cap doesn't reflect activity. Decentralized networks are growing.
-10B+ daily API requests served by @infura_io
-1M+ @trufflesuite downloads
-1M+ @metamask_io downloads
-12K+ live @Ethereum nodes
-48M+ unique #Ethereum addresses
-3x @LinkedIn #blockchain job openings— Joseph Lubin (@ethereumJoseph) December 1, 2018
Now, the exponential growth—and underlying demand is the main reason why Joseph Lubin is convinced that Blockchain is more than a market but a movement. Infura alone has had more than 10 billion API request. MetaMask has more than 10 million downloads and Truffle–which is used by ShapeShift, Aragon, and others—and MetaMask has one million downloads.
That’s not all, other metrics that show increasing base activity despite free falling ETH prices includes the number of active ETH addresses—exceeding 48 million. At the same time governments are positive on the chain with Austria via Oesterreichische Kontrollbank (OeKB) issuing $1.35 billion worth of federal bonds back in September.
Blockchains are solving real-world problems. Governments get it.
-Israel’s encrypted messaging system
-Estonia’s electronic healthcare record trials
-Dubai’s 2020 initiative
-South Africa Reserve Bank’s @goquorum trial
-Japan’s e-voting system
-Zug @uport_me IDs + crypto ATMs— Joseph Lubin (@ethereumJoseph) December 1, 2018
ETH/USD Price Analysis
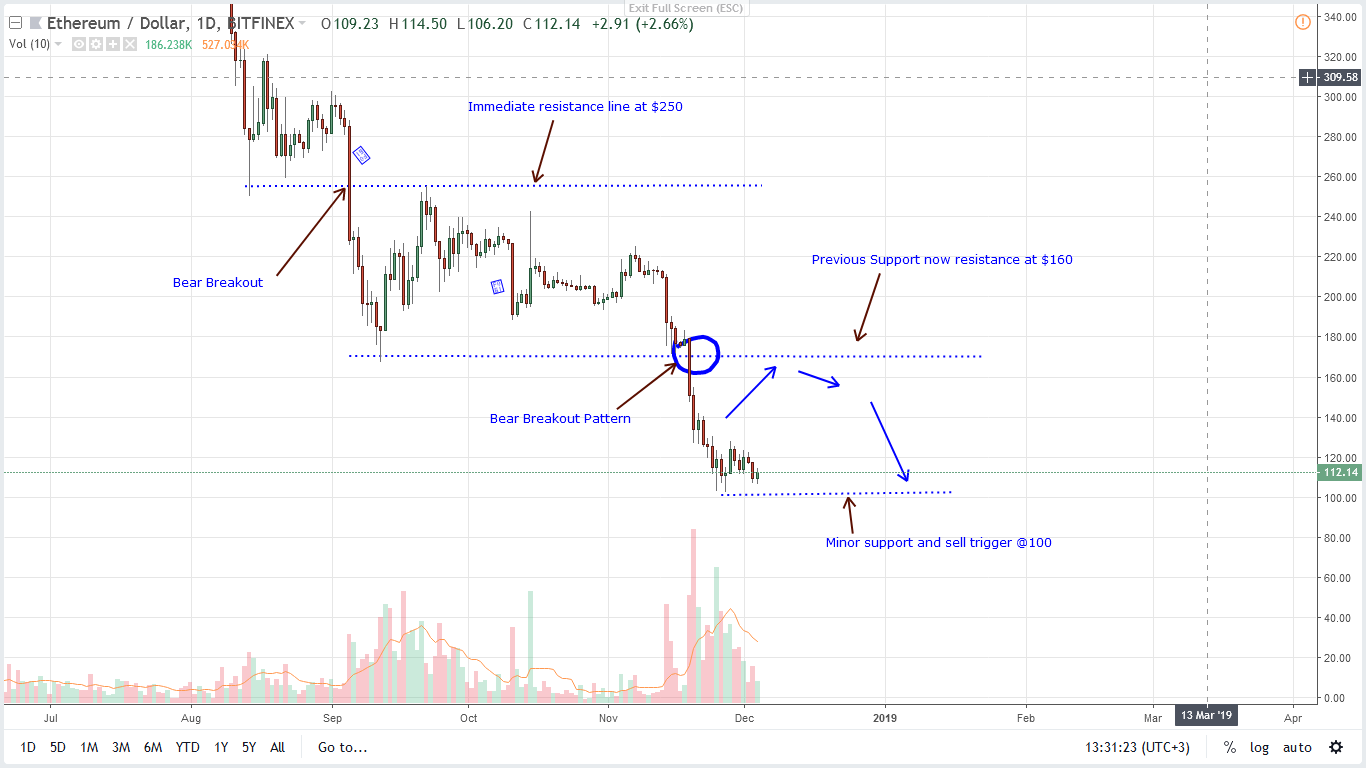
There are hints of support but at $12 away from $100, we are far from convinced that there is a shift of momentum and bulls are back in contention. At spot prices, ETH/USD is up 2.4 percent in the last week and down two percent from yesterday’s close.
Still, ETH/USD is trending in shaky grounds and how prices react at $100 could be shaping for ETH in the short to medium term. Ideally, we would like to see rallies above $130 after a 92 percent drop from 2018 peaks.
Trend: Bearish
Of course, after 11 months of steady declines that have seen ETH prices drop more than 90 percent from Jan peaks, the path of least resistance is southwards. This means ETH/USD is bearish and from the chart volatility is low but nonetheless, prices are trending within a bear breakout pattern following steep declines of Nov 19.
Volumes: Stable but Bearish
Notably, in our daily chart is Nov 25 bull pin bar. While it did print as a bull in an otherwise steep decline shoring prices and preventing a devastating crash below $100, the bar was backed by above average volumes—1.179 million versus 620k. And even after that ETH/USD prices are still oscillating within Nov 25 high low.
Candlestick Formation: Accumulation/Distribution, Bear Breakout Pattern
Because of Nov 19 high-volume, bear bar breaking below $160—the lower limit of support line, ETH/USD is trading within a bear breakout pattern. Now, because of the past seven days stability, ETH could either be in a distribution or accumulation phase depending on breakout direction. Rallies above $130 could be the latter while discouraging drops below $100 shall be a distribution and bear trend continuation.
Conclusion
Trading ETH/USD is simple. Bears are in charge. But, convincing breaks above $130 at the back of strong volumes shall usher in the next wave of bull pressure aiming at $160, $250 and even $400. If not and there is distribution further exerting pressure on ETH leading to price collapse below $100, then we could see drops re-testing $40 by end year.
All Charts courtesy of Trading View.
This is not Investment Advice. Do your Own Research.


