Latest Ethereum News
After a period of “irrational exuberance” back in 2017 when supposed entrepreneurs were waxing lyrical, drafting artists to oil their white papers and even going overboard by launching a flashy website, the creation of a minimum viable product is what counts. It doesn’t matter the lip service and marketing agents.
Read: Binance To Add 3 New Stablecoin Pairs: PAX/TUSD, USDC/TUSD and USDC/PAX
After all, drafting a third party to market a product will instantly attract the keen eye of the US SEC who will not only force charges and slap huge settlement but force would be investors to comply with their terms of operation. That doesn’t bode with maximalists who don’t see the need of a trusted third party forcing their way in a system that’s self verifying.
Thing is the community is waiting for action and after a year that saw coin holders register losses, the partnership between Halo Holdings, ConsenSys and AMD will remain as just that until there are movements on the ground. With their shaking hands, the objective will be to develop solutions for government and big corporations’ data centers for processes or workloads that rely on blockchain.
Also Read: Stablecoins, Tokenization and the Future of Bitcoin in 2019
Consensys will handles the software part—obviously using the Ethereum platform, AMD will supply hardware while Halo Holdings with bases in Abu Dhabi will bankroll what they have now called W3BCLOUD or Web 3.0 Blockchain Cloud.
Today, @ConsenSys and @AMD have announced collaboration on developing high-performance hardware technologies capable of better scaling and proliferating decentralized networks, especially for large corporations and governments. #W3BCLOUD https://t.co/fcfIQijVyy pic.twitter.com/Vq7XMFo9uH
— Joseph Lubin (@ethereumJoseph) January 4, 2019
Ethereum (ETH) Price Analysis
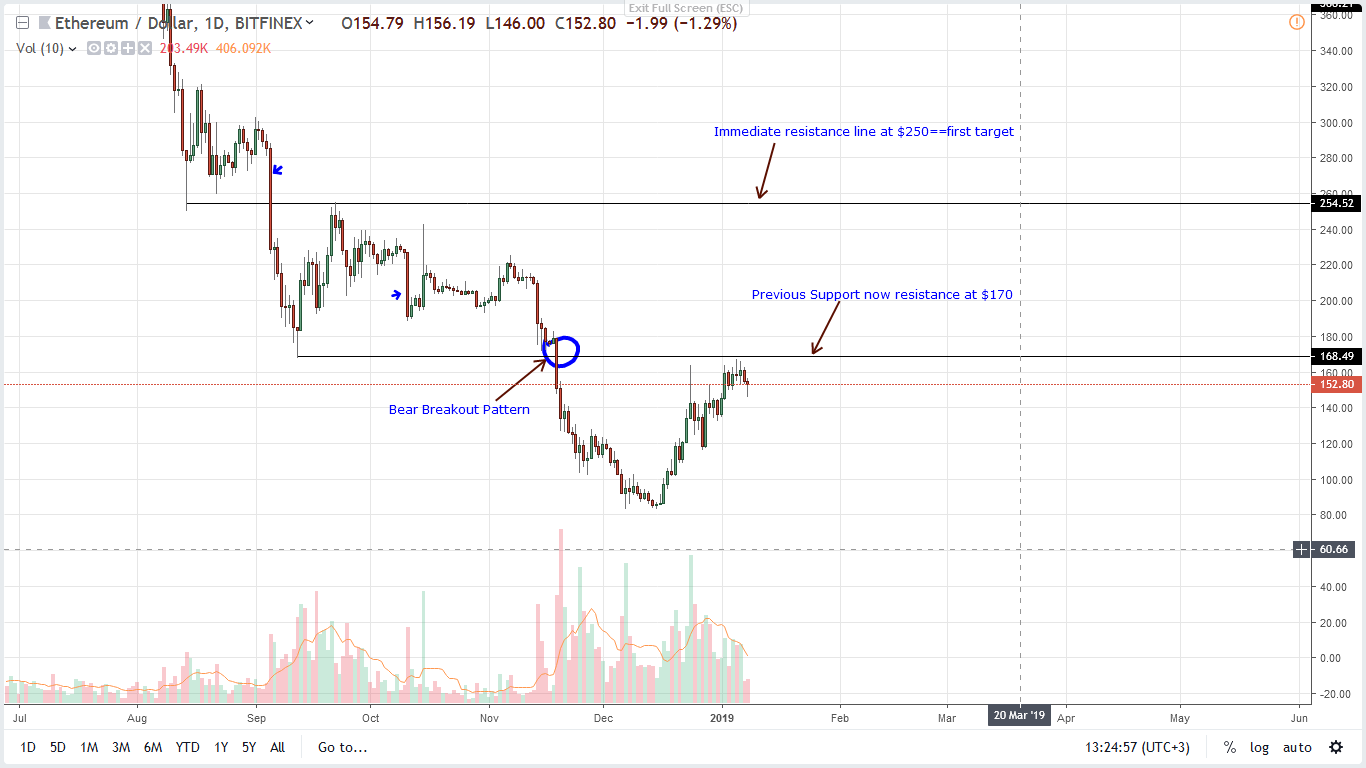
At spot prices, ETH is one of the top performers adding 12.7 percent from last week at the time of press. With the addition, ETH is trading above $150 boosting market participants morale after a disconcerting 2018. Even still, prices are trading at a pivotal level and price trajectory for the near term will mostly depend on how bulls react at spot prices. From the chart, it is clear that $170 is not only resistance but marks the base from where Nov 2018 meltdown began.
Trend and Candlestick Formation: Bearish, Breakout pattern
Losses through Nov-to-December 2018 highlight the general mood of last year. Bears reigned supreme and as they are conspicuous, it is still too early to call bull shots despite the recent rejuvenation that has seen prices rally from $71—Nov 2018 lows to above $150—an aggressive buy trigger line.
From the chart we notice that not only are we trading within a bear breakout pattern courtesy of Nov 18 steep losses but bulls are confined within Nov 2018 high low two months after the drastic re-evaluation of ETH prices. As such, ETH is technically bearish. Furthermore, recent higher highs may turn out to be a retest of the breakout level–$170, now resistance.
Volumes: Increasing, Bearish
ETH/USD transaction volumes are decent but below those of Nov 20, 2018 bear bar when volumes spiked to 1.58 million against 468k. As we can see, this is bearish and unless otherwise there are counter trends that propel ETH prices to new levels with volume exceeding those of Nov 20, then we remain bearish.
There have been attempts of higher highs on Dec 24 when volumes rose to 1.28 million against 591k but the bull bar was not confirmed ending up with a long upper wick hinting of bears in lower time frames. Ideally, moves above $170 should be accompanied by volumes above 1.70 million—and must be confirmed.
Conclusion
In light with the above, it is increasingly becoming clear that ETH bulls must drive prices above $170 at the back of high volumes. Assuming that is the case, our ETH/USD trade plan will be as follows:
Buy: $170, or on Pull backs
Stops: $150
Target: $250, $400
All Charts Courtesy of Trading View—Streams from BitFinex
This is not Investment Advice. Do your own Research.


