Ethereum price failed to clear the $185.00 and 0.0350BTC resistances versus the US Dollar and bitcoin respectively. ETH to BTC is currently trading with a bearish bias and it could drop to 0.0315BTC.
Key Talking Points
- Ethereum price recovered recently, but it failed to gain strength above 0.0350 against bitcoin.
- There was a break below a major bullish trend line with support at 0.0336 on the 4-hours chart of the ETH/BTC pair (data feed from Poloniex).
- The pair is currently trading with a bearish angle and it could slide towards the 0.0315 support.
Ethereum Price Chart Analysis
Recently, there was a decent rise in bitcoin, litecoin, Ethereum, EOS, bitcoin cash, ripple, and others against the US Dollar. However, ETH to BTC struggled to gain bullish momentum above the 0.0350 and 0.0352 resistance levels.

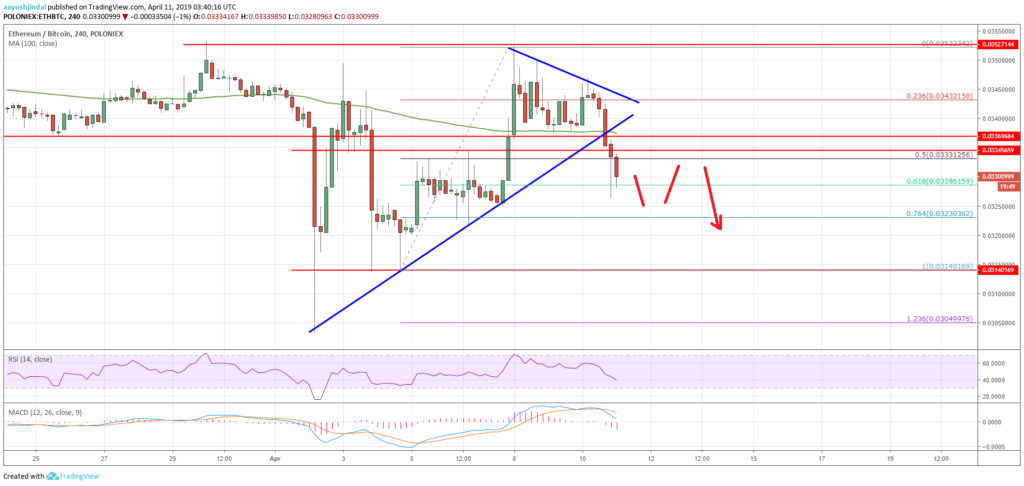
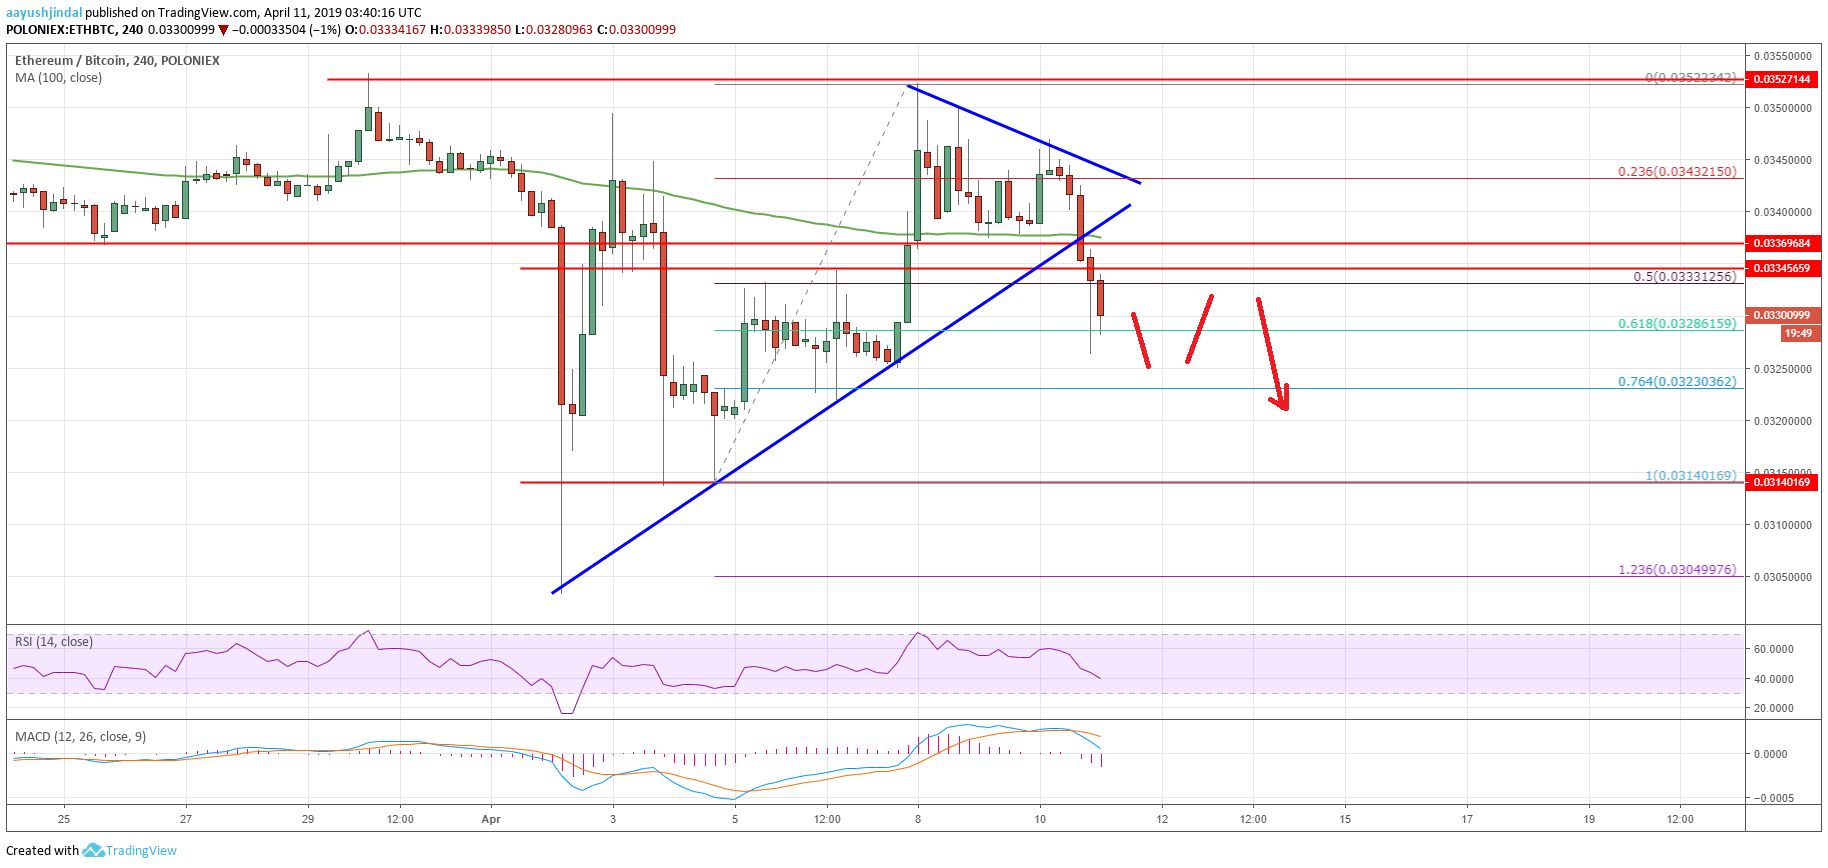
Looking at the chart, the price revisited the key 0.0350BTC resistance area recently and formed a swing high at 0.0352BTC. Later, there was a fresh decline below the 0.0345BTC support and the 100 simple moving average (4-hours).
The price even broke the 50% Fib retracement level of the last wave from the 0.0314BTC low to 0.0352BTC high. More importantly, there was a break below a major bullish trend line with support at 0.0336 on the 4-hours chart of the ETH/BTC pair.
The pair settled below the 0.0330BTC level and it is currently testing the 61.8% Fib retracement level of the last wave from the 0.0314BTC low to 0.0352BTC high. The current price action is clearly bearish, suggesting more losses below the 0.0328BTC support in the near term.
The next major support is near the 0.0320BTC level. If there are additional losses, Ethereum could dive towards the 0.0315BTC support area in the near term. On the upside, the previous supports at 0.0334BTC and 0.0336BTC are likely to act as strong hurdles for buyers.
Overall, Ethereum price is clearly trading in a bearish zone below 0.0340BTC and it may continue to slide. The main support is at 0.0315BTC where ETH buyers are likely to take a stand in the coming sessions.
The market data is provided by TradingView.

