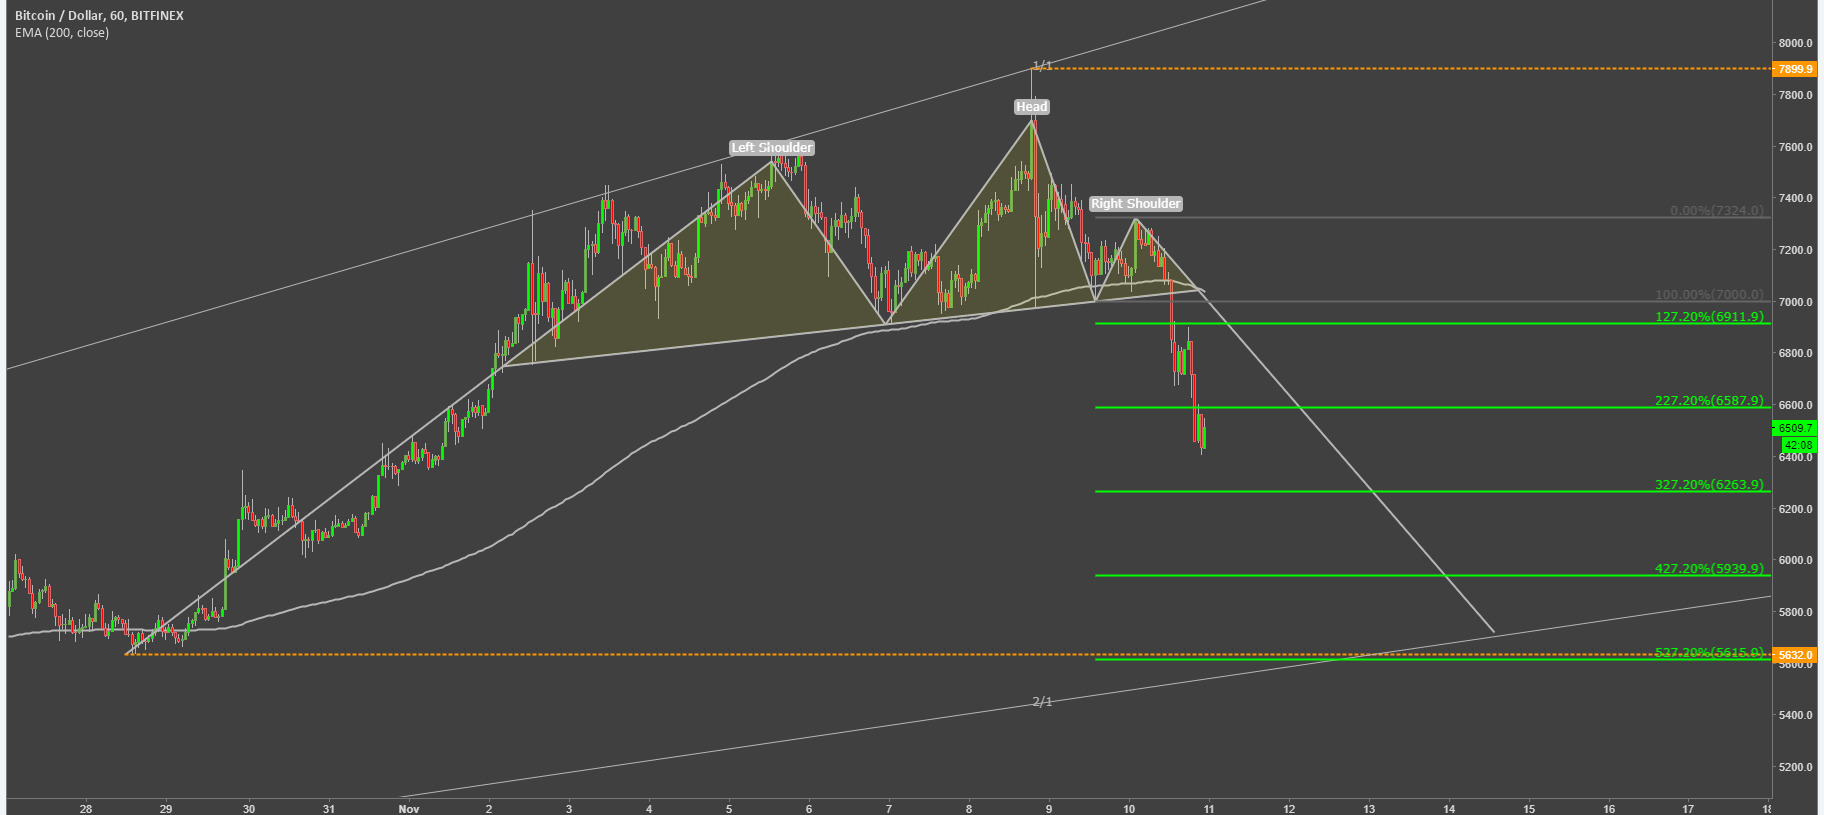
On the 8th of November, Bitcoin has reached an all-time high, hitting $7900. After Bitcoin has formed a head and shoulders pattern and it looks like it will continue to go down.
The neckline of the Head And Shoulders has broken which is a confirmation of a trend reversal. It is possible that the neckline will be tested again and BTC/USD will return to $6900 area.
Although looking at the $6910, which is at 127.2% Fibonacci retracement level applied to the right shoulder, it was already rejected, thus it has already acted as a resistance. Nevertheless, the price could return there, but Bitcoin has already in a corrective phase that could send price back to $5600 area. $5600 is the 527.2% Fibonacci level that is corresponding with the 2/1 trendline of a Gann Fan indicator.
The overall long-term trend is upwards while the correction down is likely to continue at this stage. How far? It is yet to be seen.


