Analysts Adamant Bitcoin Bottom Is In
Over the past few months, there has been a large hubbub around Bitcoin (BTC) falling under $2,000. Most analysts looking for the asset to fall under such a level cite the Hyperwave, a form of analysis that often applies to (bubble-prone) assets that have the ability to spark monumental macroeconomic shifts, like cryptocurrencies, Dotcom stocks, and Japan’s 70s and 80s stock market rally.
The creator of the Hyperwave theory himself, Tyler Jenks of Lucid Investment, has claimed that Bitcoin could fall to the $1,000s if his analysis is sound. And his students/proponents of the theory would agree. In fact, Financial Survivalism recently took a 0.1 BTC bet with Murad Mahmudov that Bitcoin will hit $1,165 before $10,200.
However, some are sure that Bitcoin has bottomed, and will not fall under $3,000 at least until the next cycle, if at all. As Crypto Wolf remarked in response to Jenks’ recent bearish appearance on analyst Tone Vays’ Youtube channel, the Bitcoin collapse in November and December, which saw BTC lose 50% of its value in a month, brought its three-day Relative Strength Index (RSI) well under 20 (oversold range). This, in the eyes of Wolf, is a clear sign of “f**kin capitulation.”
Others would agree. As CL recently accentuated, Bitcoin’s one-day chart from August to now looks eerily like that of the bottom of the 2014 to 2016 market cycle. In fact, three specific events in these two cycles are effectively identical from a technical standpoint. Firstly, the capitulation event saw a monumental red volume candle. Secondly, a failed bear market rally occurred on little volumes. And lastly, the breakout past resistance was met with record buying volume. As CL writes: “if history repeats, we’re out of the bear market.”
Crypto Might Not Be Home Free Yet
In spite of the aforementioned analysis, some are sure that bears are still in control.
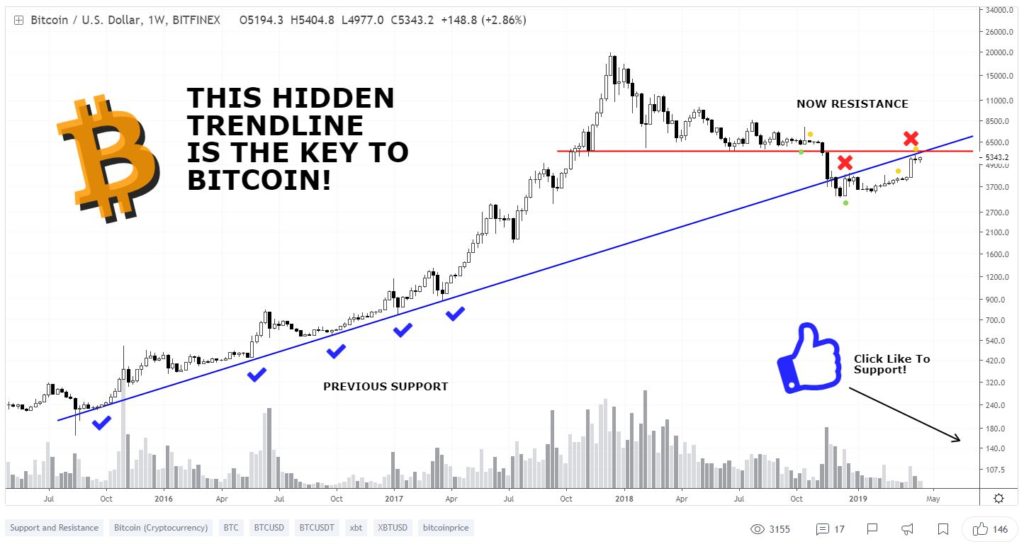
As Jacob Canfield depicts in the chart below, Bitcoin has seen a “hidden trend line” develop since late-2015, which supported BTC during four drawdowns in the 2016 to 2017 run-up. However, during this bear market, that former key support level has turned into heavy resistance. Earlier this year, BTC tried to pass $4,400, but was rejected off that trendline, and last week, BTC tried its hand at pushing past $5,500. This move, as you know, failed miserably, with the asset seeing an immediate 10% pullback to $4,950 as a result of the rejection.

Thus, the analyst remarked that for Bitcoin to enter into its next bull run, investors will need to reclaim the trend line by convincingly surpassing $5,700 in the coming days and weeks. So in other words, until BTC breaks the trendline, which will head higher and higher with time, bears still have their hands on the cryptocurrency driving wheel.
Title Image Courtesy of Marco Verch Via Flickr

