Litecoin price rallied above the $100.00 resistance level before correcting lower against the US dollar. LTC declined below the $98.00 support after a strong decline in bitcoin and Ethereum.
Key Talking Points
- Litecoin price surged towards the $108.00 level before correcting lower (Data feed of Kraken) against the US Dollar.
- There was a break below a key bullish trend line with support at $92.50 on the hourly chart.
- LTC price broke the $90.00 support level and traded as low as $83.99 recently.
Litecoin Price Analysis (LTC)
In the past three days, there was a strong rally in bitcoin, coupled with gains altcoins such as Ethereum, EOS, litecoin and ripple against the US Dollar. The LTC/USD pair surged above the $95.00 and $100.00 resistance levels before it faced sellers near the $107.50 and $108.00 levels.

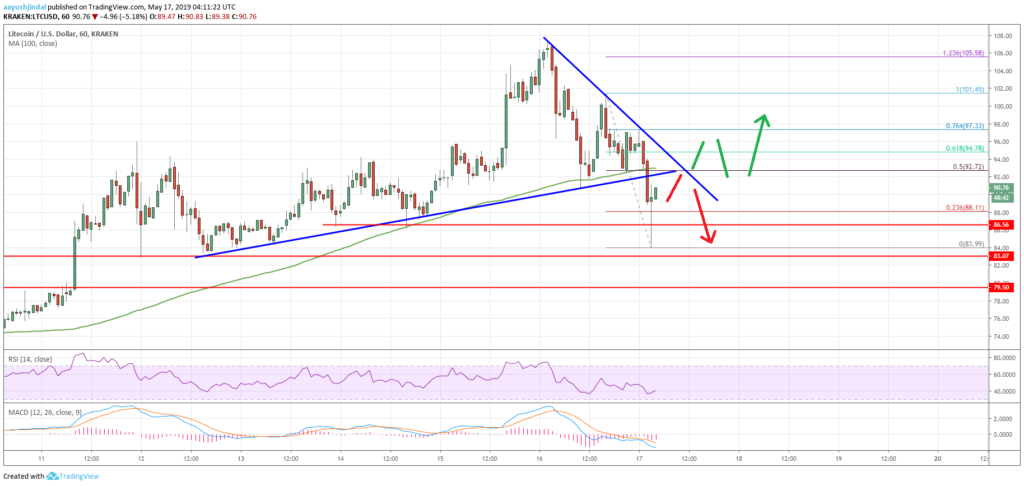
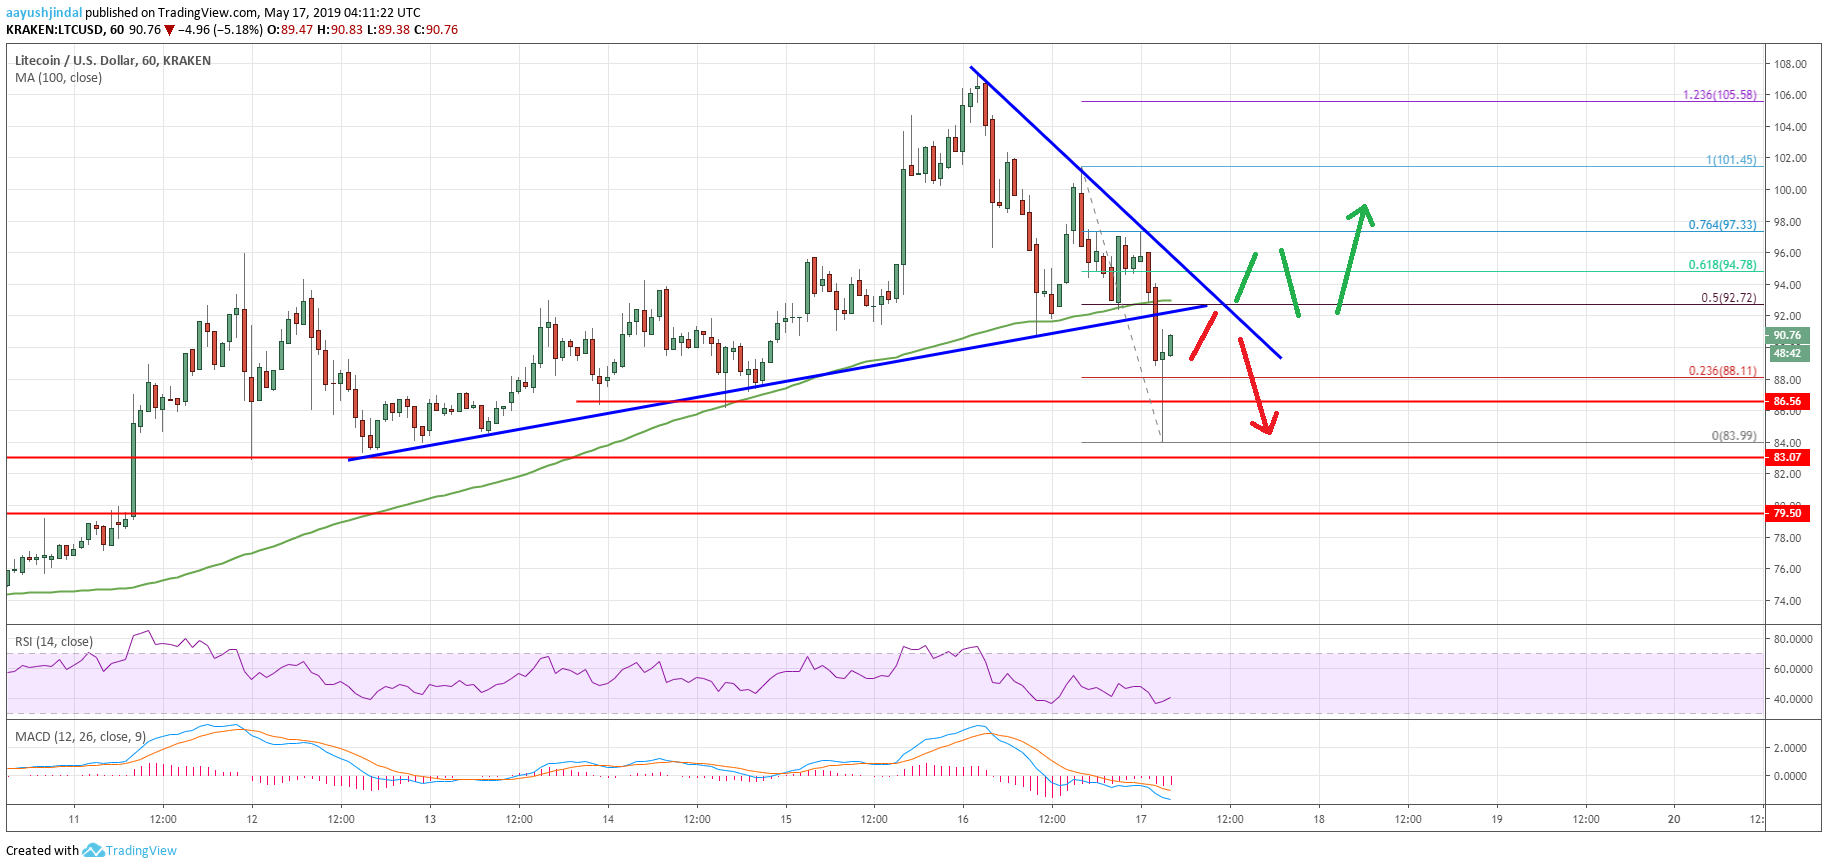
Looking at the chart, LTC price traded as high as $107.40 and recently started a heavy downside correction. It broke the $102.00 and $100.00 support levels to enter a short term bearish zone.
During the decline, there was a break below a key bullish trend line with support at $92.50 on the hourly chart. The pair even broke the $90.00 support level and settled well below the 100 hourly simple moving average.
A swing low was formed at $83.99 and the price is currently recovering higher. It climbed above the 23.6% Fib retracement level of the recent decline from the $101.45 high to $83.99 swing low.
However, there are many hurdles near the $92.50 and $94.00 levels. The 100 hourly simple moving average is positioned along with the previous support trend line and a connecting bearish trend line on the same chart at $92.70.
Therefore, the price is likely to struggle to clear the $92.70 and $93.50 resistance levels. A close above the $94.00 level might start a fresh increase in litecoin price towards $100.00 and $105.00.
Conversely, if LTC price fails to climb above the $94.00 level, it could decline once again. On the downside, the main support is near the $83.00-84.00 zone, below which it could test $79.50.
The market d2ata is provided by TradingView.

