Litecoin price tested the $61.25 resistance again and failed to gain traction against the US dollar. LTC is currently correcting lower, but dips remain supported near the $59.50 and $59.00 levels.
Key Talking Points
- Litecoin price started a downside correction after testing the $61.50 level (Data feed of Kraken) against the US Dollar.
- There was a break below a couple of short term bullish trend lines with support near $60.50 on the hourly chart.
- LTC price could extend the current downside correction towards the key $59.00 support area.
Litecoin Price Analysis (LTC)
This week, there were decent gains in bitcoin, Ethereum, EOS, litecoin and ripple against the US Dollar. The LTC/USD pair climbed above the $60.00 and $61.00 resistance levels before sellers appeared near $61.20-61.50.

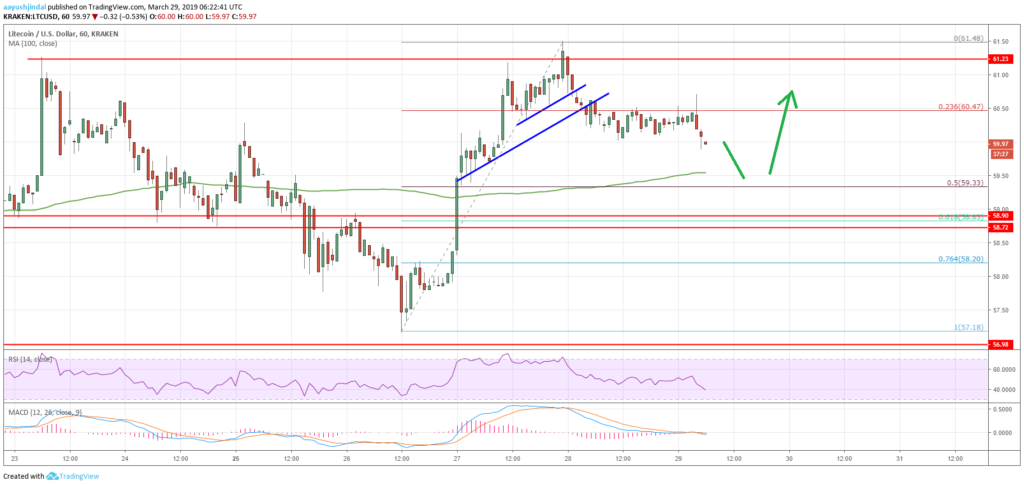
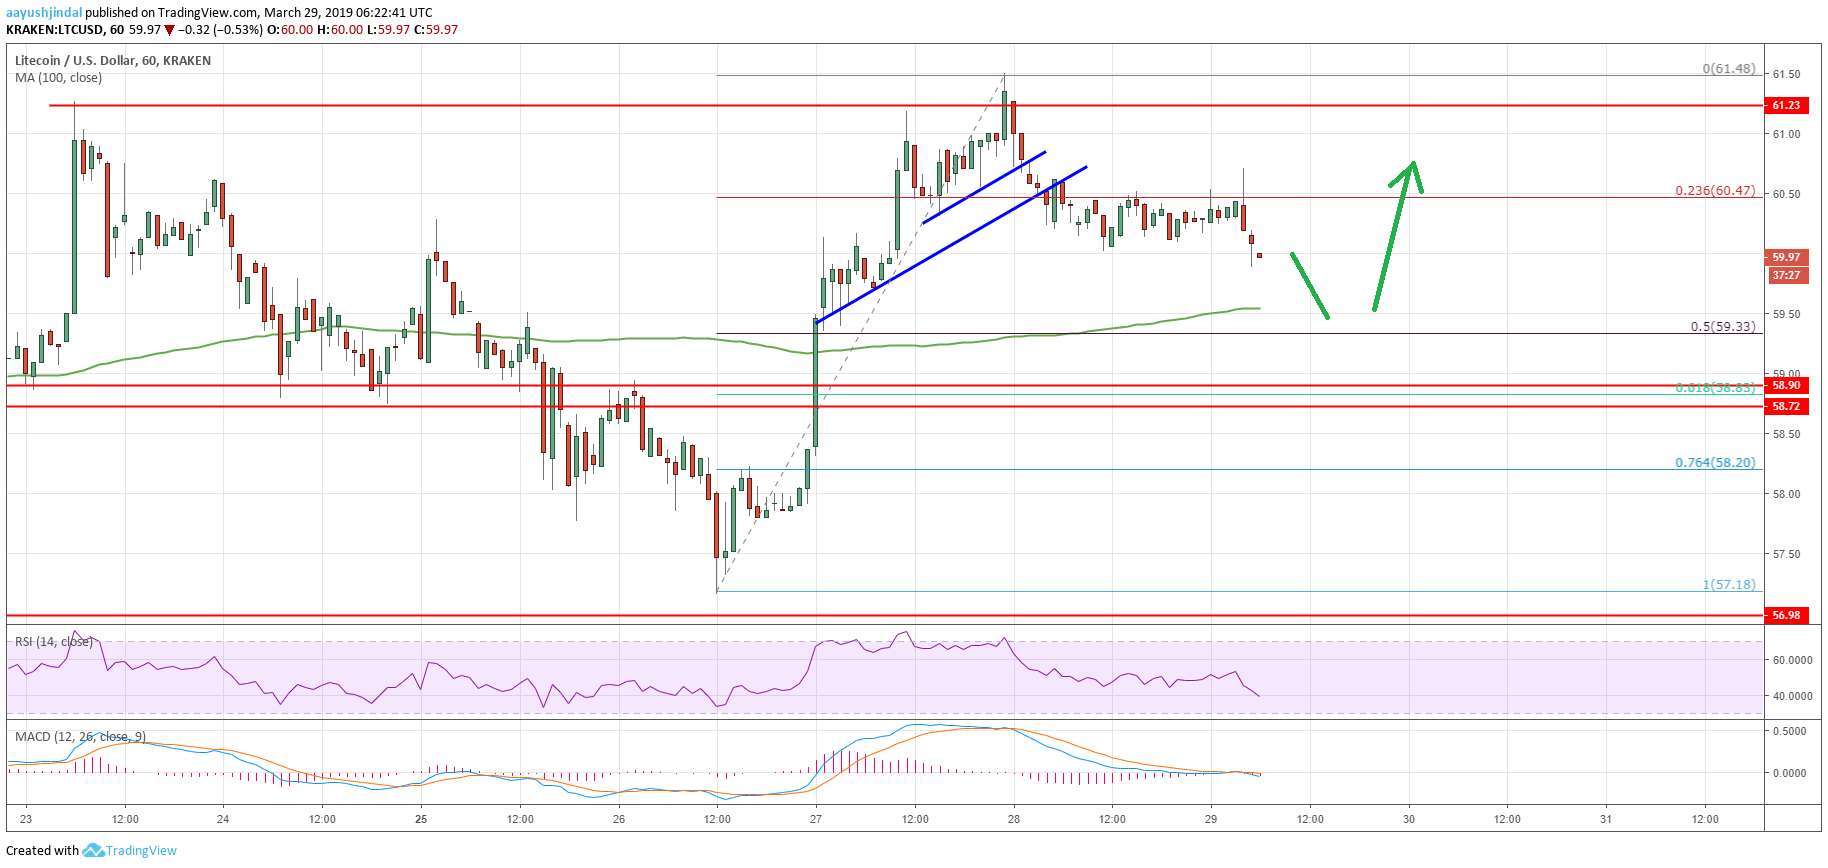
Looking at the chart, LTC price recently traded above the $61.20 resistance and traded to a new weekly high at $61.48. However, buyers failed to retain momentum, sparking a downside correction below the $61.20 and $61.00 levels.
The price traded below the 23.6% Fib retracement level of the last wave from the $57.18 low to $61.48 high. Moreover, there was a break below a couple of short term bullish trend lines with support near $60.50 on the hourly chart.
The pair even broke the $60.00 level recently and it may continue to move down. The next key support is near the $59.50 level and the 100 hourly simple moving average.
The next support is near the $59.33 level and the 50% Fib retracement level of the last wave from the $57.18 low to $61.48 high. However, the main support is near the $59.00 level, which is also a strong pivot zone.
Overall, litecoin price is currently correcting lower from the $61.48 high. LTC price could gain momentum below $60.00, but there are many supports on the downside near the $59.50 and $59.00 levels. On the upside, an initial resistance is at $60.80, above which the price may revisit the $61.20 and $61.50 resistance levels. A clear break above the $61.48 high might push the price towards $64.00.
The market data is provided by TradingView.

