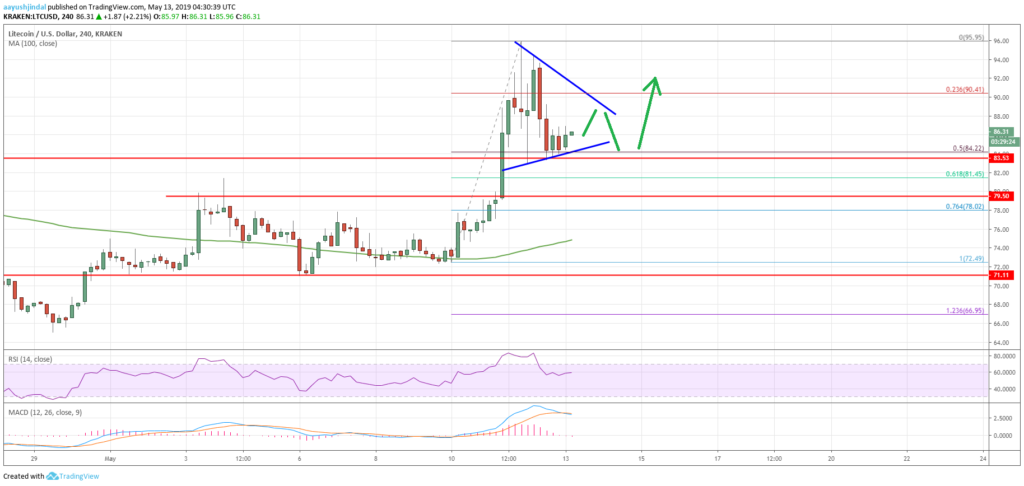
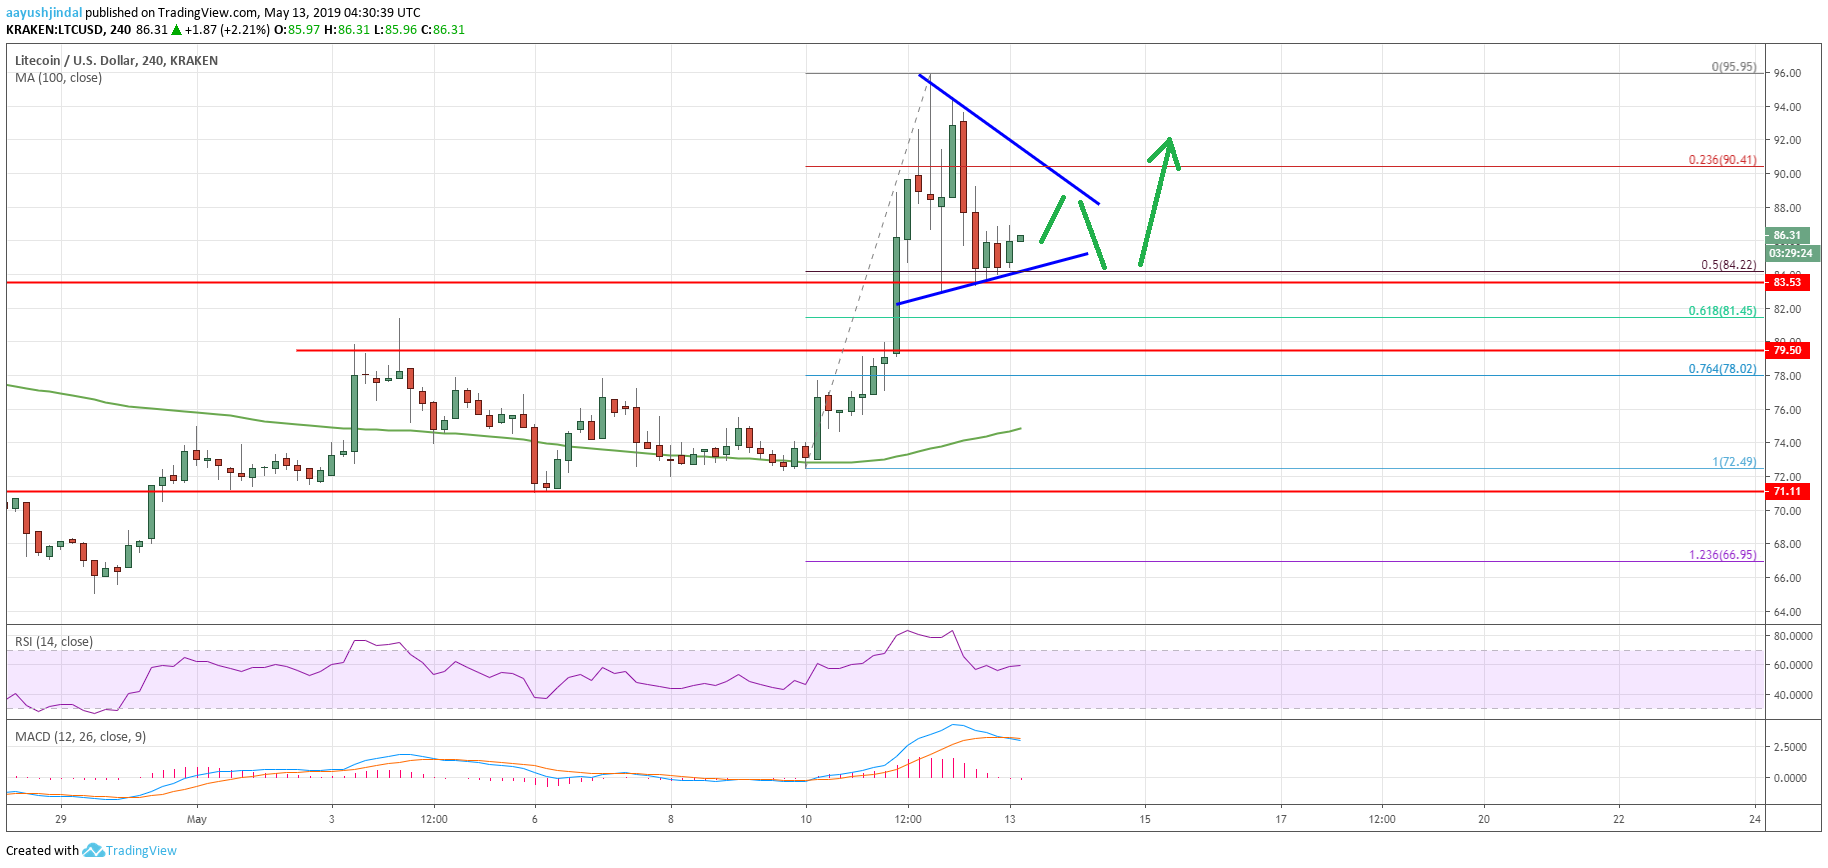
Litecoin price surged higher above the $84.00 and $90.00 resistance levels against the US Dollar. LTC traded as high as $95.95 and recently corrected lower towards the $84.00 support.
Key Talking Points
- Litecoin price jumped sharply above the $84.00 and $90.00 resistance levels (Data feed of Kraken) against the US Dollar.
- There is a key contracting triangle forming with support near $84.50 on the 4-hour chart.
- LTC price remains well supported on the downside near the $84.00 and $80.00 levels.
Litecoin Price Analysis (LTC)
This past week, there was a sharp rally in bitcoin, resulting in gains in most altcoins such as Ethereum, EOS, ripple and litecoin against the US dollar. The LTC/USD pair formed a strong support base above the $72.00 level and rallied above the $80.00 resistance level.

Looking at the 4-hour chart, LTC price gained traction above the $84.00 and $90.00 resistance levels. There was even a close above the $84.00 resistance and the 100 simple moving average (4-hour).
It opened the doors for more gains above the $92.00 level. The price traded to a new 2019 near the $95.95 level and recently started a downside correction. It broke the $90.00 support, and the 23.6% Fib retracement level of the last wave from the $72.49 low to $95.95 high.
However, the previous resistance near the $84.00 level acted as a support. Besides, the 50% Fib retracement level of the last wave from the $72.49 low to $95.95 high acted as a support.
At the outset, there is a key contracting triangle forming with support near $84.50 on the 4-hour chart. If the price breaks the triangle resistance near the $88.00 level, it is likely to resume its upside above the $90.00 and $92.00 levels.
Conversely, if there are additional losses below the $84.50 and $84.00 support levels, litecoin price could revisit the main $80.00 and $79.50 support levels. As long as LTC is trading above the $79.50 pivot level, it remains in an uptrend and it is likely to break the $90.00 resistance once again in the near term.
The market data is provided by TradingView.

