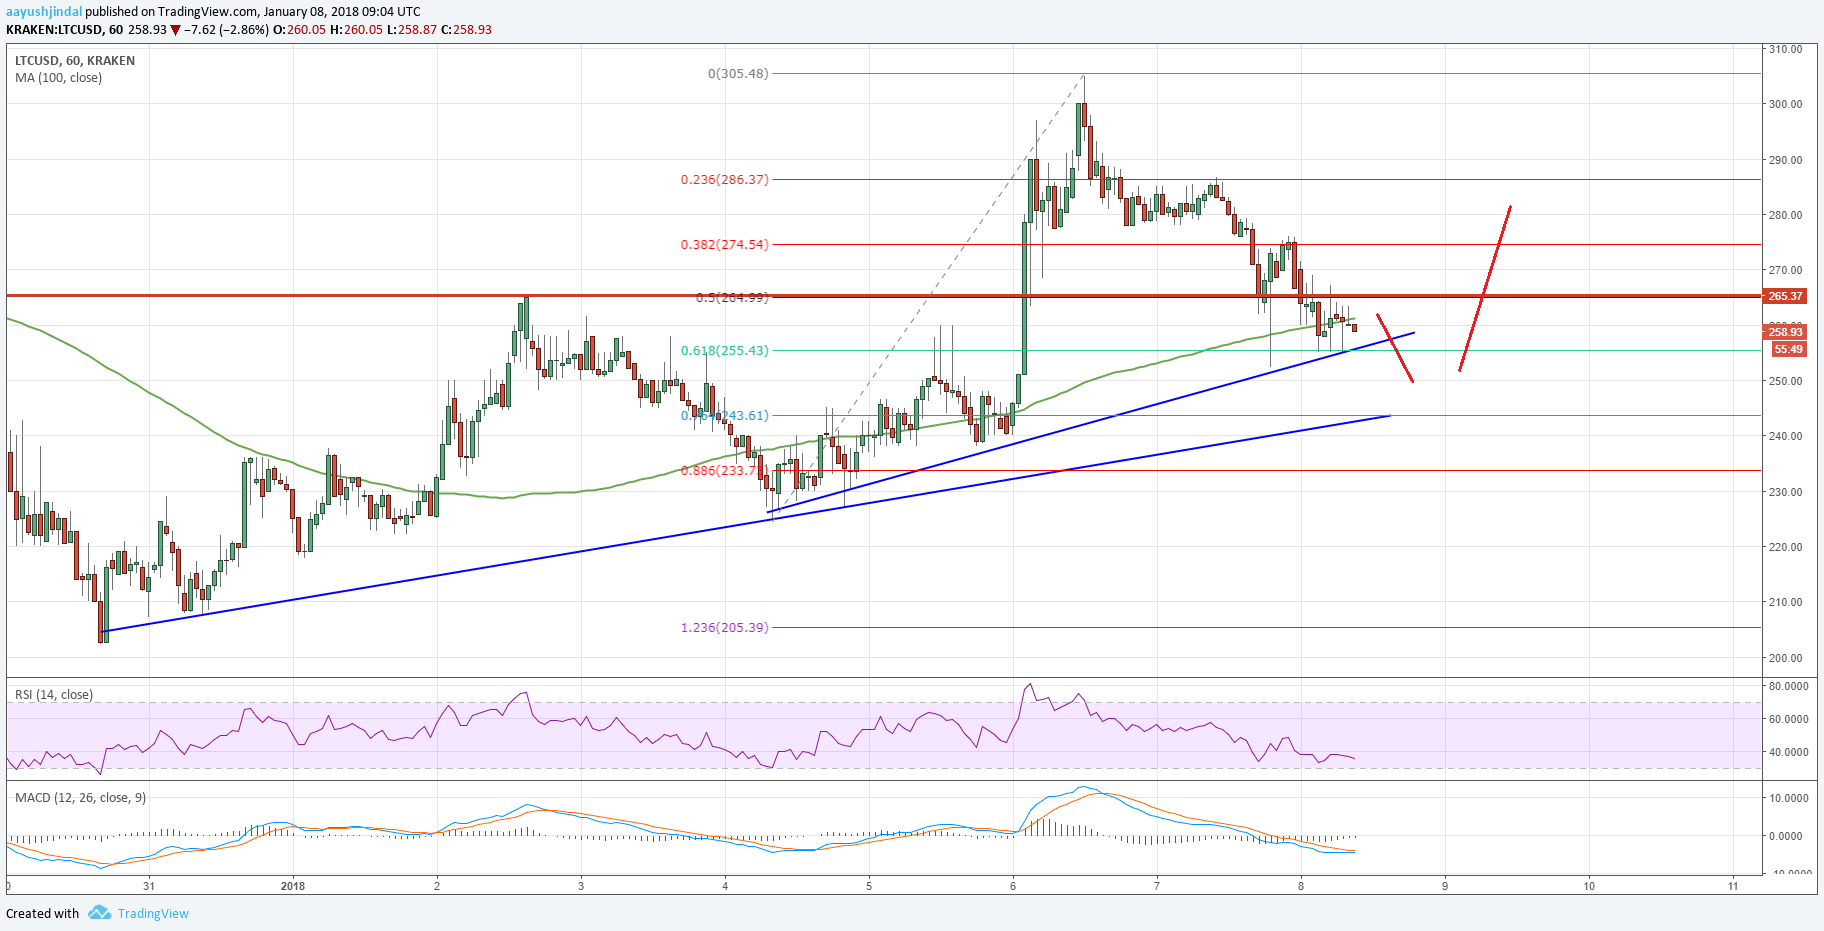
Litecoin price started a fresh downside move after failing near $305 against the US Dollar. LTC/USD is now approaching a major support at $240-250.
Key Talking Points
- Litecoin price managed to move higher recently and traded as high as $305 (Data feed of Kraken) against the US Dollar before starting a correction.
- There are two connecting bullish trend lines forming with supports at $255 and $245 on the hourly chart of LTC/USD pair.
- The pair is likely to stay above $245 and move back above the $270 level in the near term.
Litecoin Price Forecast
In the previous analysis, I mentioned that Litecoin price may bounce back above $250 against the US Dollar. The LTC/USD pair did move higher and was able to move above the $250 and $260 resistance levels.
The upside move was positive and the pair traded as high as $305 before it faced selling interest. Later, a downside move was initiated and the pair moved below the 50% Fib retracement level of the last wave from the $225 low to $305 high.

However, a major support area around $250 and the 100 hourly simple moving averages are preventing downsides. There are also two connecting bullish trend lines forming with supports at $255 and $245 on the hourly chart.
The 61.8% Fib retracement level of the last wave from the $225 low to $305 high is holding losses at present. As long as the price is above the $245-255 support area, there remains a chance of LTC moving higher.
Should there be a break below $245, the price could test the last swing low of $225. On the flip side, litecoin price has to trade above the $265 resistance in order to move back in the bullish zone.
A successful close above $265 and $270 would open the doors for a push toward $300 in the near term. Above $300, LTC/USD could gain traction for a run towards the $325-330 levels.
The technical indicators on the hourly chart of LTC are showing signs of a short-term trend change from bearish to bullish.
Trade safe traders and do not overtrade!
