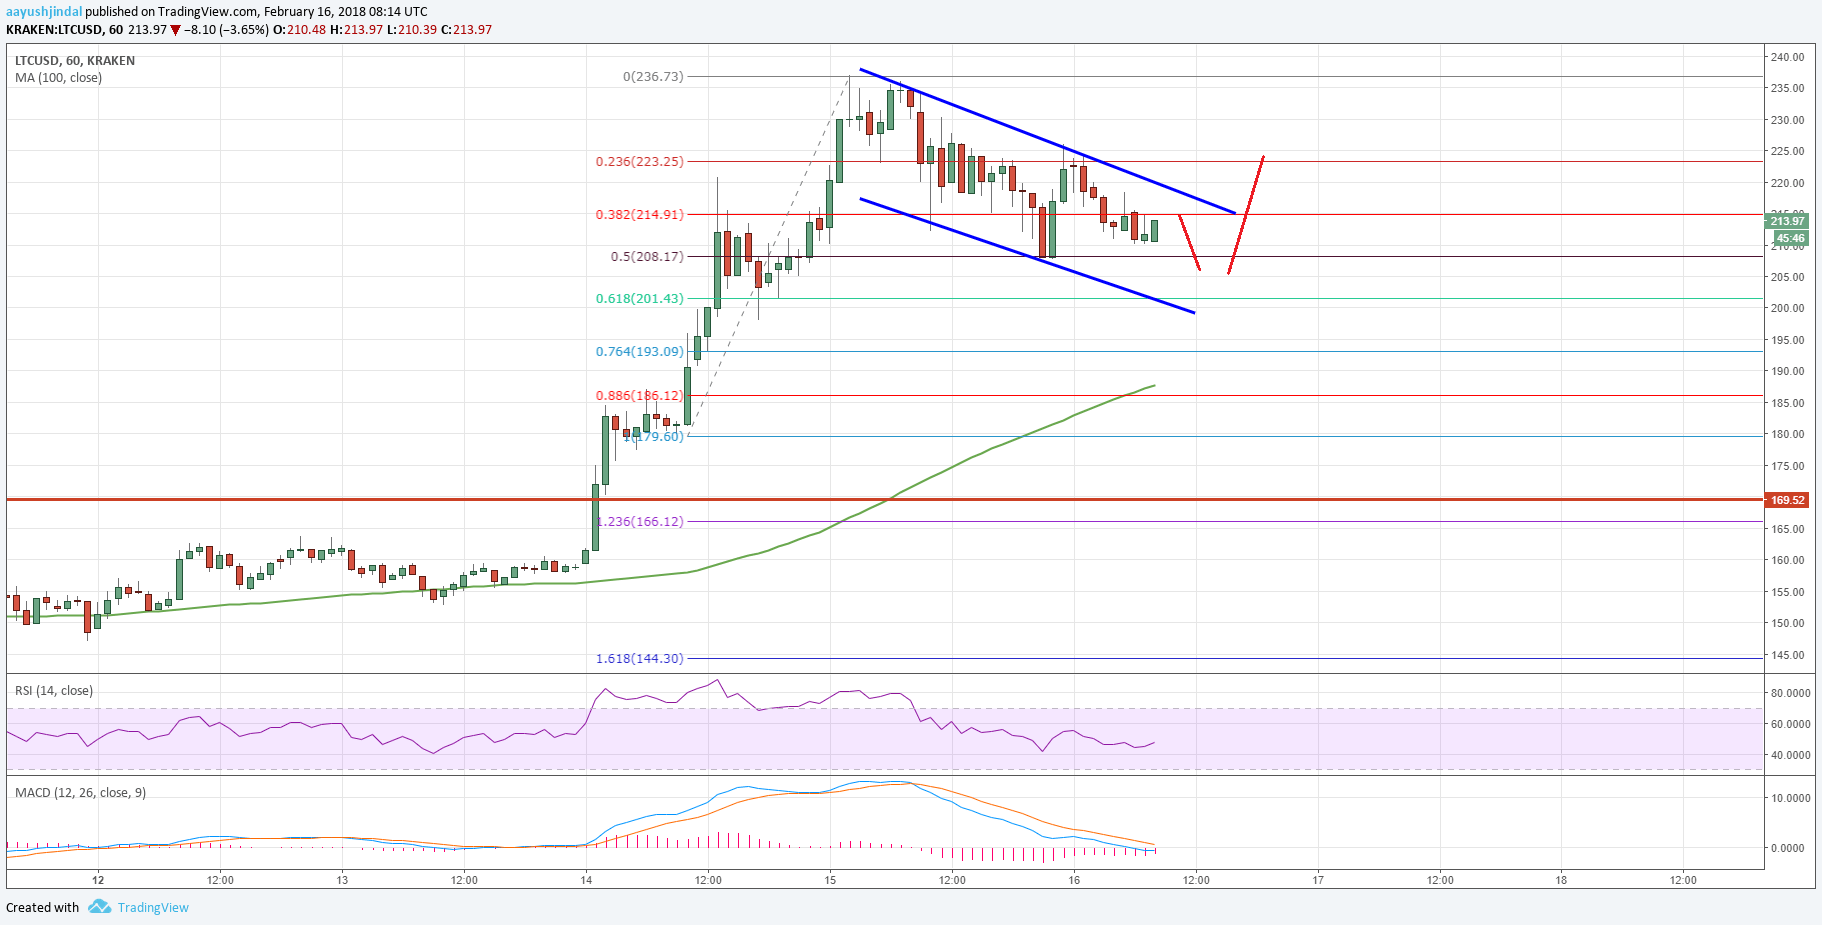
Litecoin price formed a short-term high near the $236 level against the US Dollar. LTC/USD is currently correcting lower towards the $205-200 support area.
Key Talking Points
- Litecoin price failed to move further above the $235 level and corrected lower (Data feed of Kraken) against the US Dollar.
- There is a declining channel forming with resistance at $220 on the hourly chart of the LTC/USD pair.
- The pair may correct a few more points, but the $200 support is likely to prevent declines.
Litecoin Price Forecast
Yesterday, we saw a decent upside move in litecoin price above the $200 level against the US dollar. The LTC/USD pair traded as high as $236 before it faced sellers and started a short-term downside correction.
The pair moved down and traded below the $220 support and the 23.6% Fib retracement level of the last wave from the $179 low to $236 high. The downside move was substantial as the price almost tested the $200-205 support area.
At the moment, it seems like there is a declining channel forming with resistance at $220 on the hourly chart of the LTC/USD pair. The current downside move seems to be corrective in structure as long as the price is above the $200 level.
The pair already tested the 50% Fib retracement level of the last wave from the $179 low to $236 high. It is a positive sign, but the price has to break the channel resistance at $220 to gain upside momentum.
Once there is a close above the $220 level, the price may resume its uptrend. Above $220, the price has to break the $235-236 resistance to rise further towards $250 in the near term.
On the downside, the $208 level is an initial support followed by $205. Below $205, the $200 level could be tested, which is also the 61.8% Fib retracement level of the last wave from the $179 low to $236 high.
A break below the $200 support could ignite more declines toward the $180 level.
Trade safe traders and do not overtrade!

