Litecoin price struggled and failed near the $122 resistance zone against the US Dollar. LTC/USD is currently correcting lower and it could revisit the $115 support.
Key Talking Points
- Litecoin price did not move above the $122 resistance and declined (Data feed of Kraken) against the US Dollar.
- Yesterday’s highlighted key contracting triangle with support at $121 was breached on the hourly chart of the LTC/USD pair.
- The pair is currently under pressure and it may perhaps retest the $115 and $116 supports.
Litecoin Price Forecast
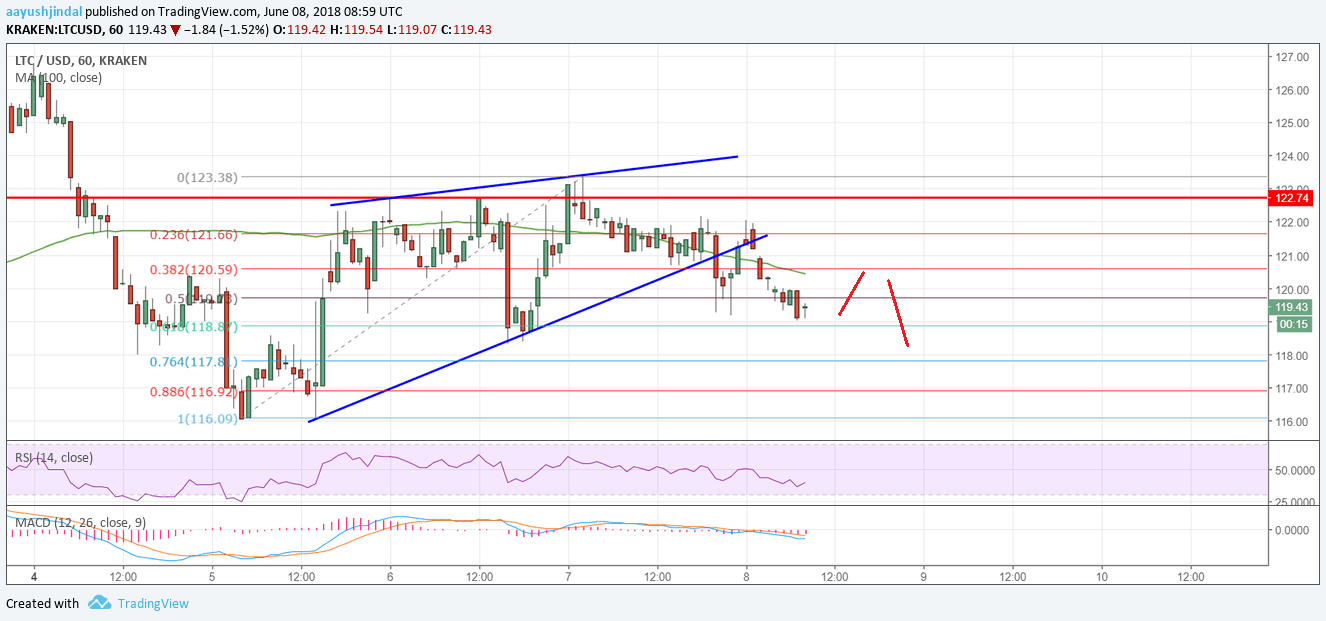
There were many attempts to break the $122-123 resistance zone, but litecoin price failed to surpass the stated barrier against the US dollar. As a result, the LTC/USD pair started a downside correction and declined below the $121 support.
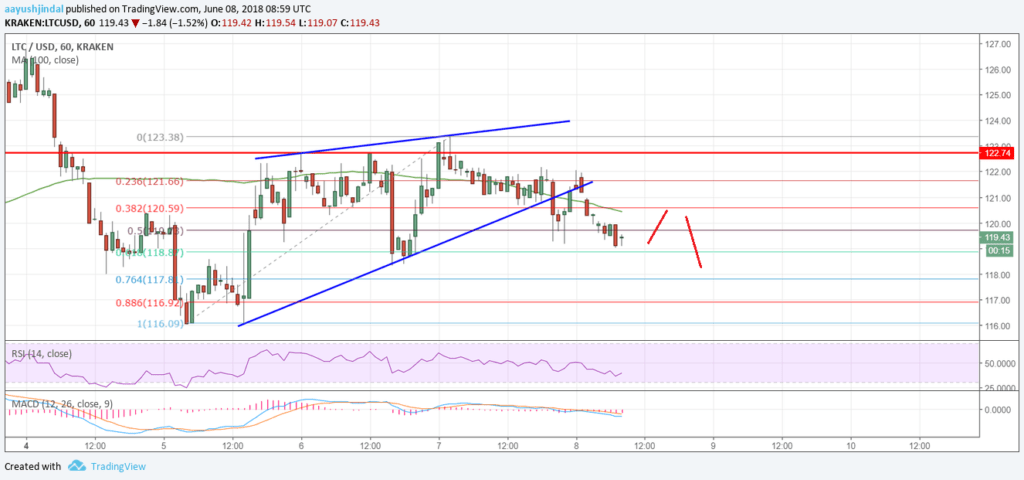
Looking at the chart, the price clearly struggled a lot above $122, increasing bearish pressures. The price declined and moved below the 23.6% Fib retracement level of the last wave from the $116.09 low to $123.38 high.
More importantly, there was a break and close below the $120 level and the 100 hourly simple moving average. Furthermore, yesterday’s highlighted key contracting triangle with support at $121 was breached on the hourly chart of the LTC/USD pair.
The pair is now trading just below the 50% Fib retracement level of the last wave from the $116.09 low to $123.38 high. There is a bearish angle forming below the $120 level and the 100 hourly SMA.
Therefore, there are chances that the price may continue to decline and trade towards the next major support at $115-116. An intermediate support is around the $117.5 level, which the 76.4% fib level of the stated wave.
On the flip side, if Litecoin price recovers and moves back above $120 and the 100 hourly SMA, it could retest the $122 resistance zone. However, a break and close above the $122 resistance zone seems to be a tough task for buyers.
The overall price action indicates minor bearish moves towards $116 if the price is below $122.
The market data is provided by TradingView.


