Litecoin price is under a lot of pressure below $135 against the US Dollar. LTC/USD may extend the current decline and it could even test the $100 level.
Key Talking Points
- Litecoin price did not recover much above the $140 level (Data feed of Kraken) against the US Dollar.
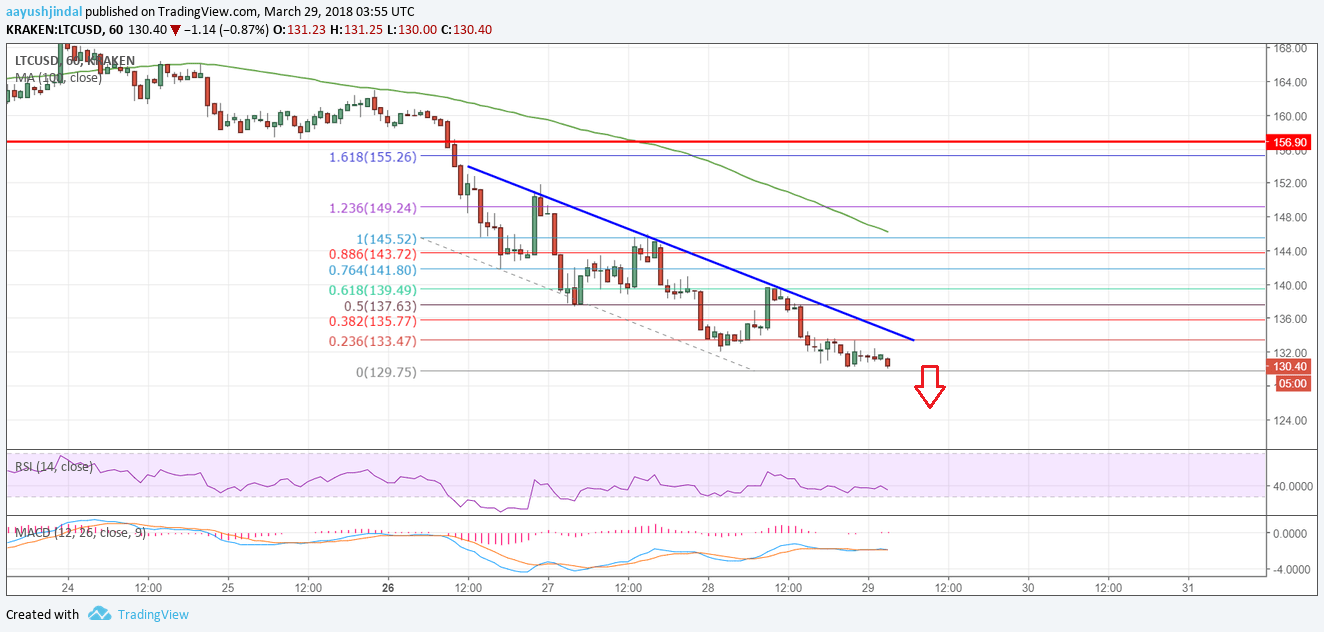
- Yesterday’s highlighted crucial bearish trend line with current resistance near $135 is still intact on the hourly chart of the LTC/USD pair.
- The pair may continue to move down and it could trade towards $120 or even $100.
Litecoin Price Forecast
It seems like sellers are in control as litecoin price declined below the $140 level against the US dollar. The LTC/USD pair is now placed well below the $148 and $150 resistance levels, which is a bearish sign.
Recently, the price corrected a few points from the $138 swing low, but the upside move was capped by the $145 level. The last swing low was $129.75 and it seems like the price may continue to move down.
On the upside, an initial resistance is around the 23.6% Fib retracement level of the decline from the $145 high to $129 low. However, yesterday’s highlighted crucial bearish trend line with current resistance near $135 is still intact on the hourly chart of the LTC/USD pair.
The pair remains in a bearish region and it could decline further below the $129 low. The next stop could be the $120 level. However, if the current trend remains intact, there are chances of LTC price even testing the $100 level.
On the flip side, if the price moves above the $135 level, the next resistance is around the 61.8% Fib retracement level of the decline from the $145 high to $129 low.
Above $140, the 100 hourly simple moving average is at $145. Only a close above $145 and the 100 hourly SMA could ignite a fresh upside move.
The overall price action is bearish with the next key support at $120.
Trade safe traders and do not overtrade!


