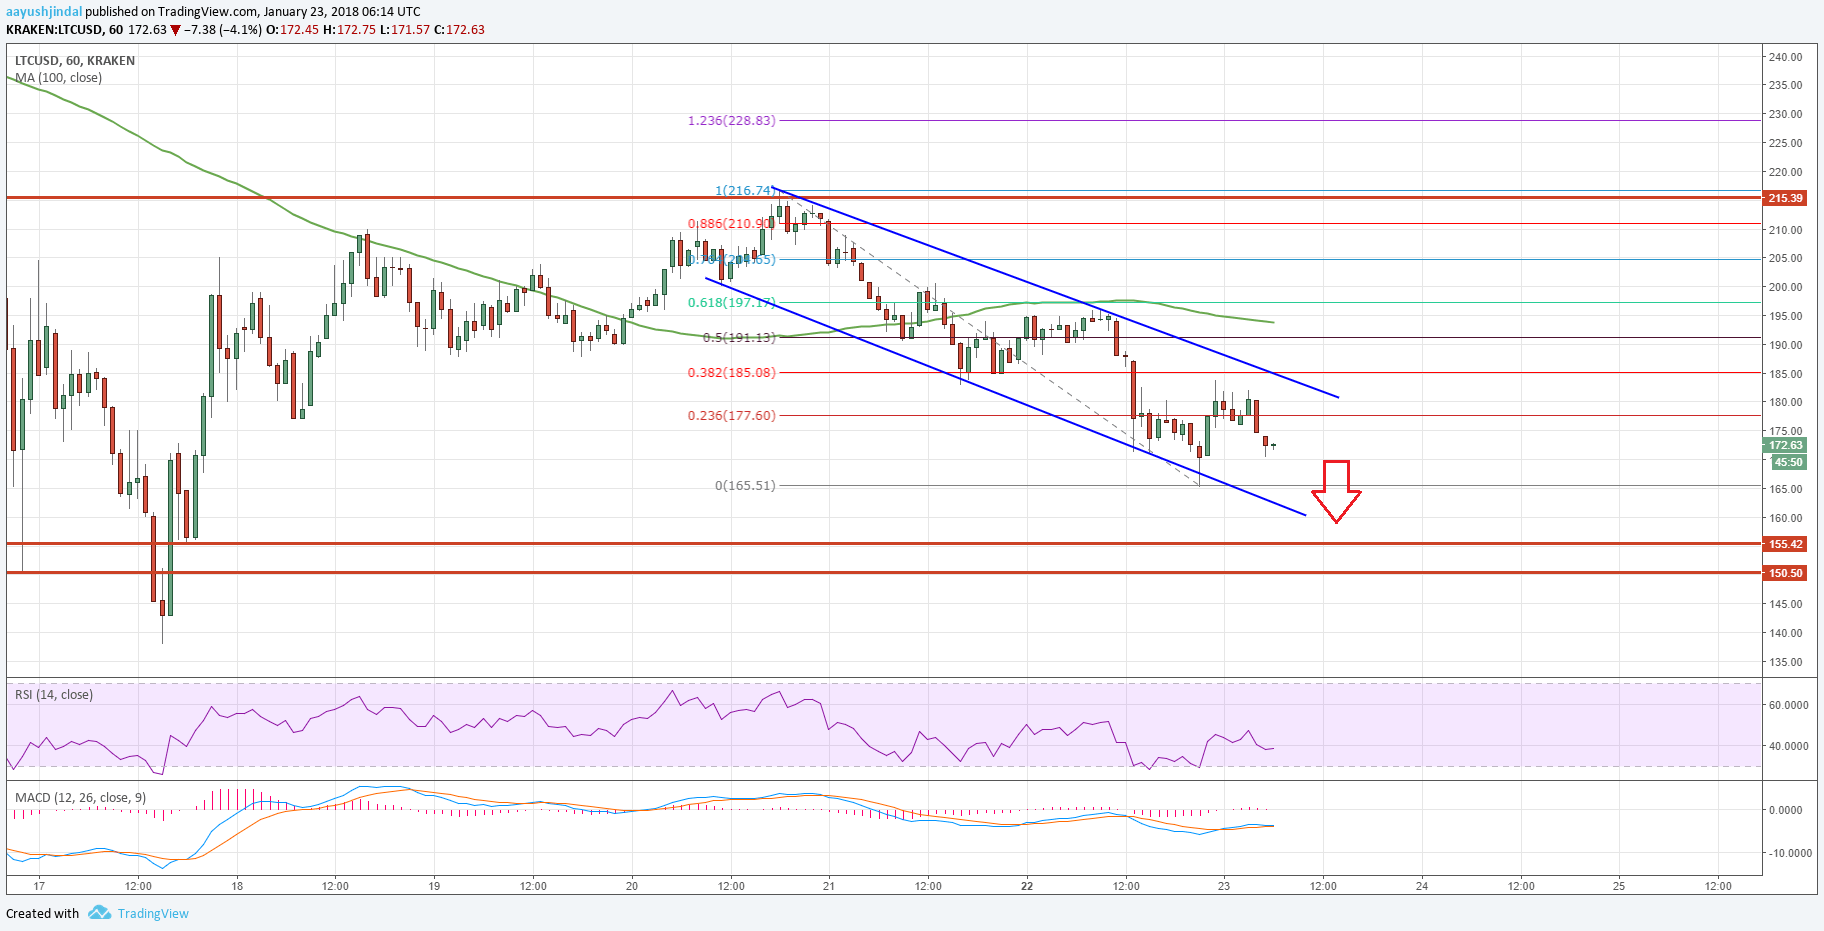
Litecoin price is struggling to recovery above $200 against the US Dollar. LTC/USD is currently below $180 and it remains at a risk of more declines in the near term.
Key Talking Points
- Litecoin price is currently under pressure and is trading below the $180 support (Data feed of Kraken) against the US Dollar.
- There is a declining channel forming with current resistance at $180 on the hourly chart of LTC/USD pair.
- The pair may continue to move down and it could test the $165 and $150 support levels.
Litecoin Price Forecast
There was a fresh downside wave initiated in litecoin price from the $216 swing high against the US dollar. The LTC/USD pair declined and moved below a couple of important support levels such as $200 and $180.
The pair even broke the 100 hourly simple moving average to slide towards $160. It traded as low as $165.51 and is currently correcting higher. It traded just above the 23.6% Fib retracement level of the last wave from the $216 high to $165 low.
Looking at the hourly chart of LTC/USD, there is a declining channel forming with current resistance at $180. The pair may correct a few points higher, but it won’t be easy to break the $180-185 resistance.
Above $185, the 100 hourly SMA is positioned at $195 to prevent further upsides. Moreover, the 50% Fib retracement level of the last wave from the $216 high to $165 low is at $191.
Therefore, there is a major resistance zone forming around $180-195. As long as the price is below $200 and the 100 hourly SMA, it remains at a risk of more declines.
On the downside, the recent low of $165 is a short-term support. However, the most important support sits at $150-155. The price must stay above $150 to avoid any major increase in selling pressure.
The overall short-term bias is bearish as long as litecoin price is trading below the $200 pivot level.
Trade safe traders and do not overtrade!

