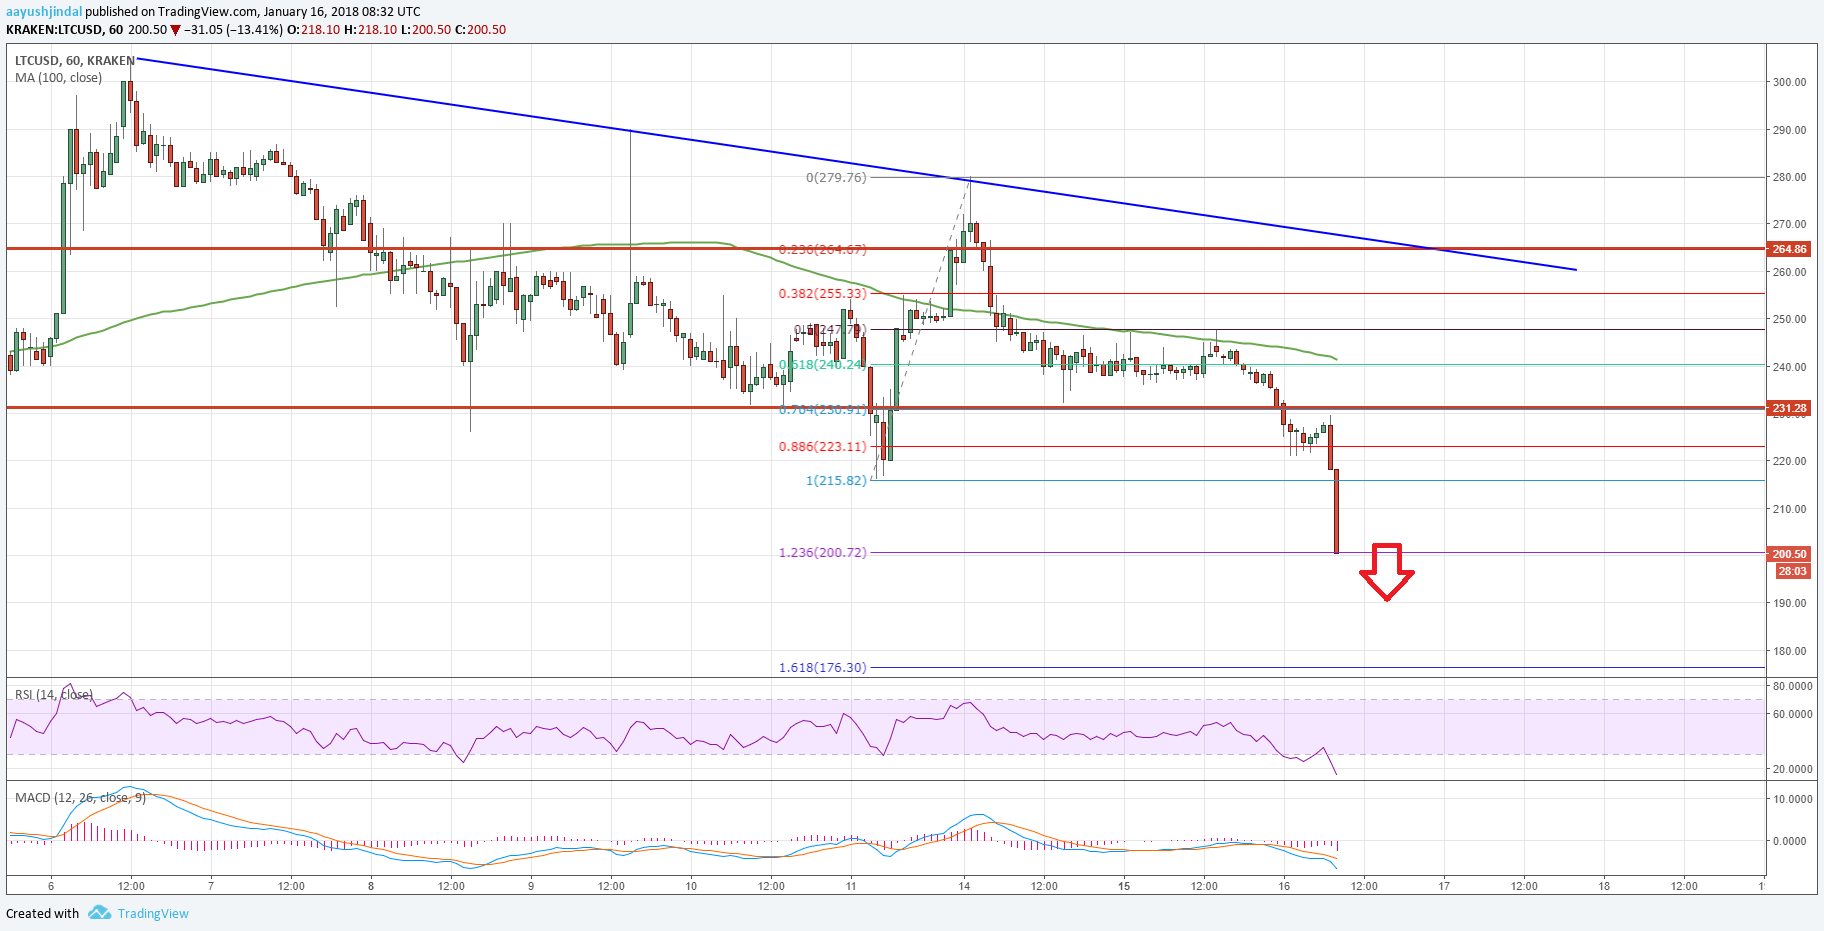
Litecoin price is under a lot of pressure and declined below $215 support against the US Dollar. LTC/USD is likely to extend declines toward the $175 level.
Key Talking Points
- Litecoin price faced a lot of selling pressure and failed to stay above the $230 support (Data feed of Kraken) against the US Dollar.
- Yesterday’s highlighted connecting bearish trend line with resistance at $260 is intact on the hourly chart of LTC/USD pair.
- The pair is heading lower towards the next major support at $175.
Litecoin Price Forecast
The past few sessions were bearish on litecoin price as it moved below the $230 support area against the US dollar. The LTC/USD pair faced a lot of bearish pressure as it even failed to hold a major support area at $215, and it is currently well below the 100 hourly simple moving average.
Recently, the market turned bearish on all cryptocurrencies, which pushed litecoin price below $215. The price is currently testing the 1.236 Fib extension of the last wave from the $215 low to $279 high.
However, it seems like the $200 handle would fail to hold the current decline. Should the current bearish pressure remains intact, the price could trade toward the $175 level. The mentioned $175 level is near the 1.618 Fib extension of the last wave from the $215 low to $279 high.
On the upside, an initial resistance is around the $230 level. The stated $230 level was as support earlier, and now it could prevent upsides. Moreover, yesterday’s highlighted connecting bearish trend line with resistance at $260 is intact on the hourly chart.
An intermediate resistance is around the $240 level and the 100 hourly SMA. It seems like there is a major bearish zone forming around the $230 and $260 levels.
As long as litecoin price is below the $260 level, it remains in a bearish zone. On the downside, the mentioned $175 support should hold declines in the current wave.
Trade safe traders and do not overtrade!

