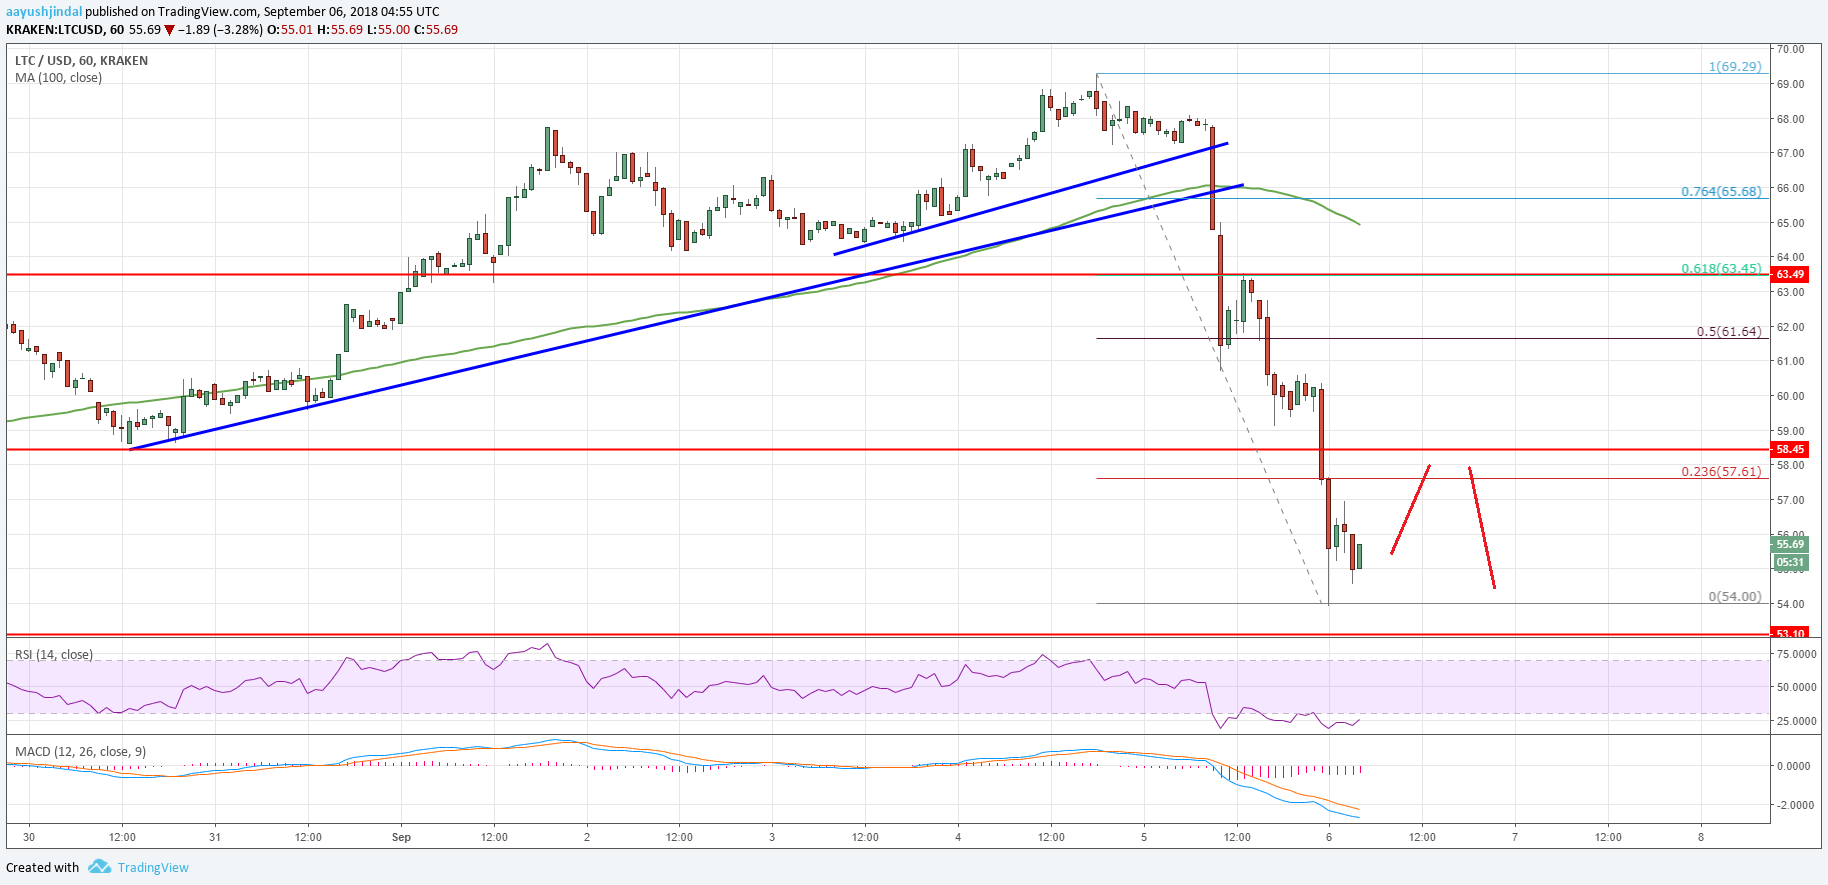
Litecoin price tumbled and broke the $60.00 support area against the US Dollar. LTC/USD is correcting higher, but it could face sellers near $58.00 and $59.00.
Key Talking Points
- Litecoin price made a sharp U-turn and declined below the $60.00 support (Data feed of Kraken) against the US Dollar.
- This week’s followed crucial bullish trend line was breached with support at $66.10 on the hourly chart of the LTC/USD pair.
- LTC price traded towards the $54.00 support area and it is currently correcting higher.
Litecoin Price Forecast
There was a major bearish reaction noted in litecoin price from the $69.30 swing high against the US dollar. The LTC/USD pair declined sharply and broke many supports like $64.00, $60.00 and even $58.00.
Looking at the chart, LTC price came under a lot of bearish pressure and started a downside move once sellers pushed the price below the $68.00 support. The price dropped significantly, broke the $60.00 support and even settled below the 100 hourly simple moving average.
During the decline, this week’s followed crucial bullish trend line was breached with support at $66.10 on the hourly chart of the LTC/USD pair. Finally, there was a break below the $58.50 support area.
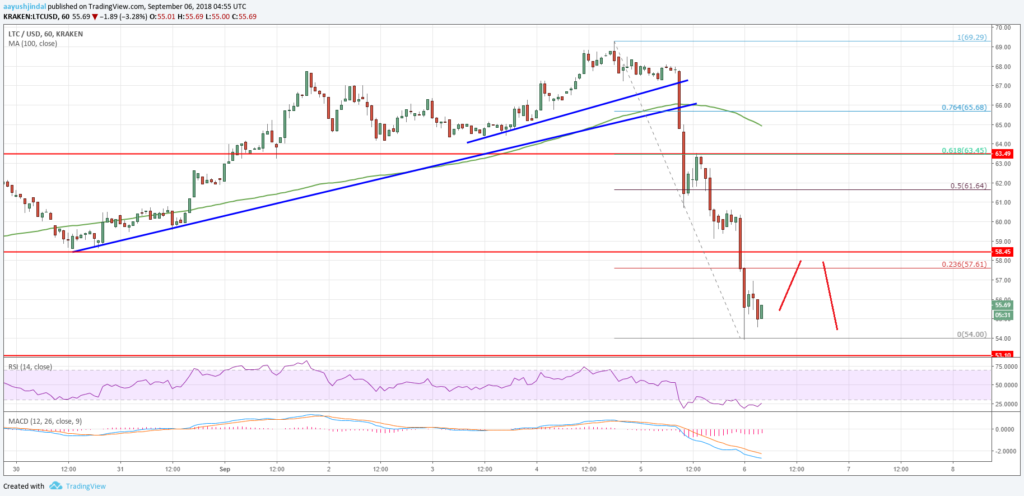
The price traded as low as $54.00 and later started a recovery. It traded above $56.00, but it seems to be facing resistance near $57.00. The 23.6% Fib retracement level of the recent drop from the $69.29 high to $54.00 low is also at $57.61 to act as a hurdle for buyers.
If the price move past, it could test the $58.50 resistance, which was a support earlier. Above this, the price may test the 50% Fib retracement level of the recent drop from the $69.29 high to $54.00 low at $61.64.
Overall, litecoin price has moved back in a bearish zone below the $60.00 support area. If LTC price recovers in the short term, it is likely to face a lot of sellers near the $57.00, $58.00 and $60.00 resistances.
The market data is provided by TradingView.


