Neo price failed to hold an important support at $51.00 and declined against the US Dollar. NEO/USD could accelerate losses towards the $48.50 and $46.00 levels.
Key Talking Points
- Neo price is currently under a lot of pressure below the $51.00 and $50.00 levels against the US Dollar.
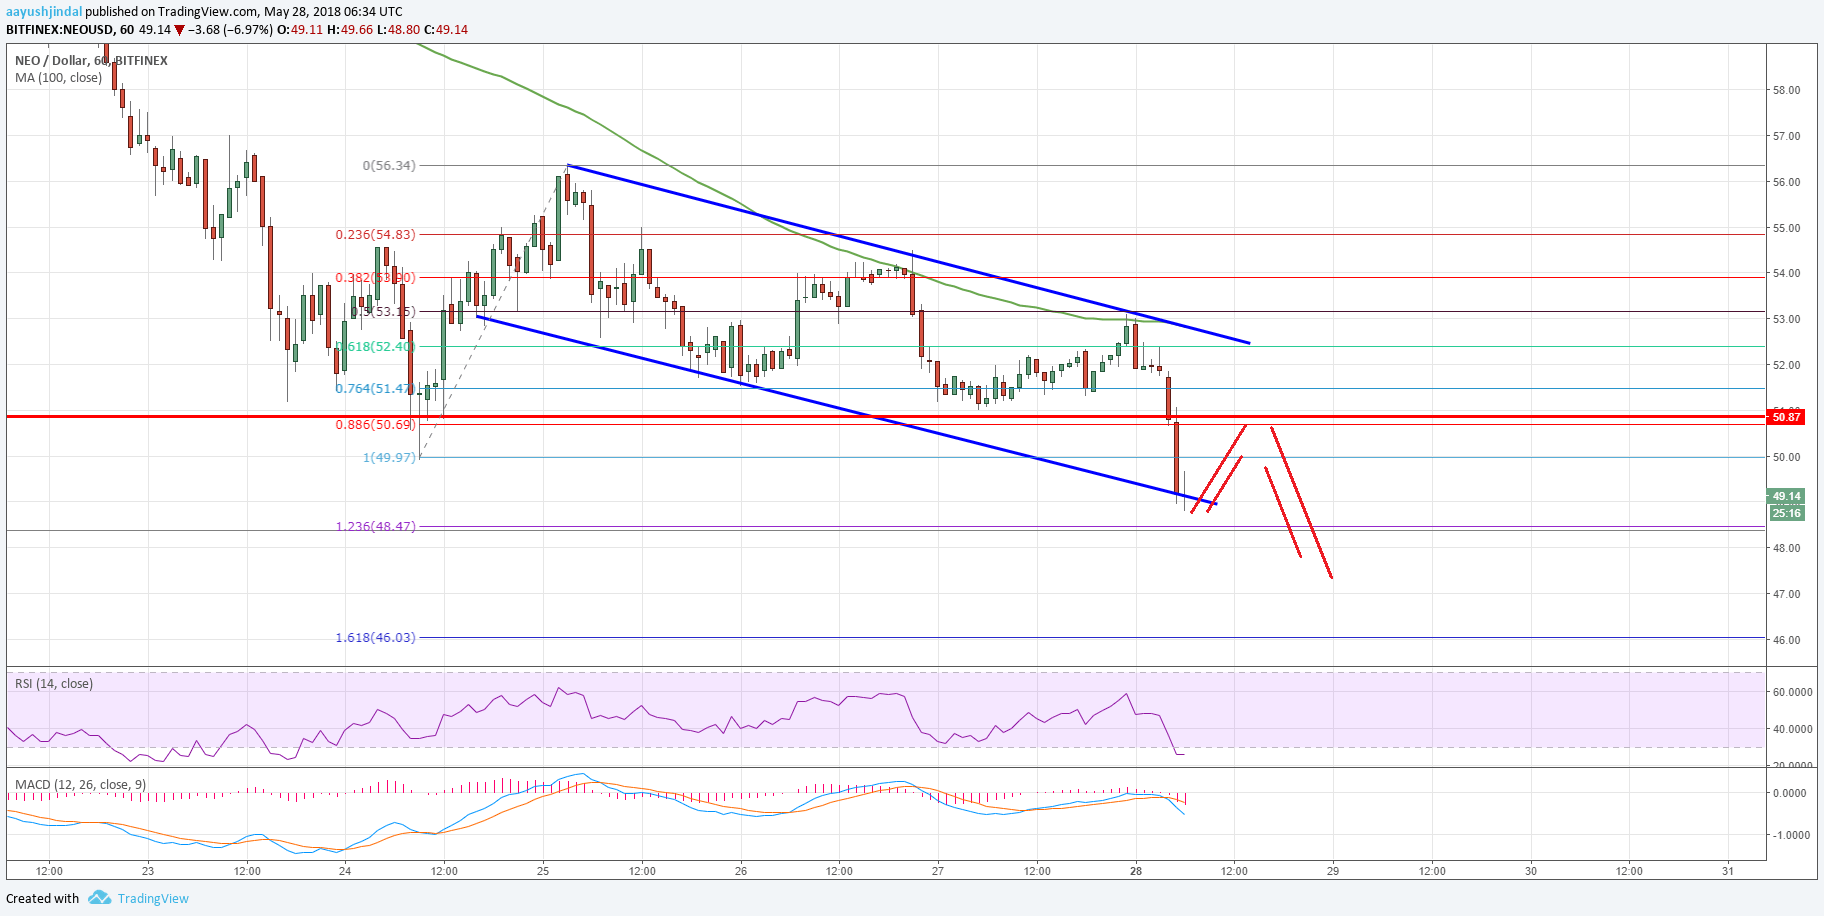
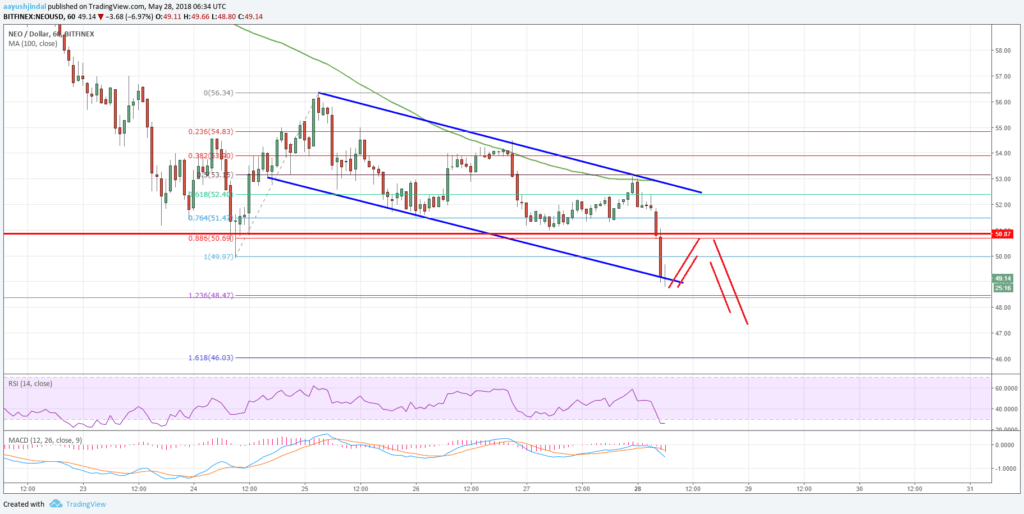
- The NEO/USD pair is currently attempting a downside break below a declining channel with support at $49.15 on the hourly chart (data feed by Bitfinex).
- The pair is likely to accelerate declines below $49.00 towards the $48.50 and $46.00 levels.
Neo Price Chart Analysis
In the last analysis, we discussed that Neo price could decline if it fails to break $55.00-56.00 against the US Dollar. The NEO/USD pair did move down and broke many supports, including $54.00 and $52.00.
The chart suggests that the price came under a lot of pressure below $55.00. Earlier, there was a slight recovery from the $49.97 low and the price moved above the $55.00 level. However, the upside move was capped by $56.50, resulting in a sharp downside move.
There was also a failure to settle above $55.00 and the 100 hourly simple moving average. Later, the NEO/USD pair started following a declining channel with resistance at $53.00 on the hourly chart.
Sellers gained control and pushed the price below the $50.50 and $50.00 levels. At the moment, the NEO/USD pair is attempting a downside break below the same declining channel with support at $49.15.
Should sellers succeed, the price could decline below $49.00 and it may well test the 1.236 Fib extension level of the last wave from the $49.97 low to $56.34 high at $48.47. Below this, the price may decline further towards $48.50 and the 1.618 Fib extension level of the same wave.
If there is an upside correction, the price may face sellers near the $50.00 level. Above $50.00, the next major hurdle is close to the $50.80 level, which was a support earlier. The last crucial barrier above $50.80 is near $53.00 and the 100 hourly SMA.
The market data is provided by TradingView.


