Valuing crypto is a tough call. How do you value an asset that, unlike equities, has no earnings and, unlike bonds, generates no income?
Sure, it could be argued reasonably that the absence of earnings and income makes bitcoin similar to gold but there is a problem with that approach when applied to crypto assets in general rather than just bitcoin.
And even when applied to bitcoin it throws up the same questions that the gold bugs have had to bat back for many a year – where’s the intrinsic value, what are its industrial use cases?
There are other ways at looking at crypto value determination, such as purchasing power parity or wallet openings, but it is developments in the NVT ratio field that has got people’s attention recently.
From quantity theory to NVT ratio…
The NVT ratio is the network value divided by transaction value. The ratio was invented and popularised by Willy Woo of the woodbull.com website.
NVT in origin owes much to the quantity theory of money, which sees money supply expanding to meet the needs of commerce. It is expressed mathematically as MV = PT, where the quantity of money in circulation multiplied by its velocity (the number of times a unit changes hands in a given period) is equal to the level of prices multiplied by the number of transactions.
NVT can be considered as a distillation of MV = PT, where the left side of the equation roughly equates to network value and the right side represents the fundamental purpose of money in that it measures transactions in the real economy or in Bitcoin’s case, the economy as given form in the transactional activity of its blockchain.
From earnings to network size
The NVT ratio is sometimes referred to as bitcoin’s price/earnings (p/e) ratio. The p/e ratio is widely used in stock analysis. For this ratio, share price is divided by the earnings of a company. A high p/e ratio is typically found among growth companies, where investors are willing to pay a high price for a share of a company’s capital in an expectation of future higher earnings.
Early-stage tech companies, for example, would likely have a high p/e compared to value stocks such as Ford which has a low p/e (5.6) because it has high earnings relative to its share price and is able to pay a dividend (income) out of profits. Tech companies such as Uber are yet to make a profit and, not surprisingly, pay no dividends. Uber, a private company, has a p/e ratio estimated to be in the 30s.
Ok, so there are no earnings but it is reasonable to assume that the value of a currency or tokenised network is a function of network size. Metcalfe’s law makes that explicit, in its original form in reference to a telecoms network. It states that the value of a network is proportional to the square of the number of users.
Metcalfe’s law and NVT can be extended (but not in isolation) to cryptocurrencies in general, although let’s stick with bitcoin for now. If the network value diverges from transaction value then that should act as a signal of unsustainable price levels. This is what a high NVT figure indicates.
Since December NVT has steadily risen, from 60 to now stand at 107, its highest level since September 2014.
NVT Signal breakthrough
However, work by Dmitry Kalichkin, chief research officer at CryptoLab Capital, has refined NVT to make it more responsive. He achieved that aim by tweaking the smoothing mechanism used by Woo in the NVT ratio. In the NVT ratio a 28-day moving average is applied to both network value and transaction value. Kalichkin, instead, only applies the smoothing to the more unstable transaction value. The result is that the NVT Signal, as Woo has christened it, now acts as a good predictor of price movements.
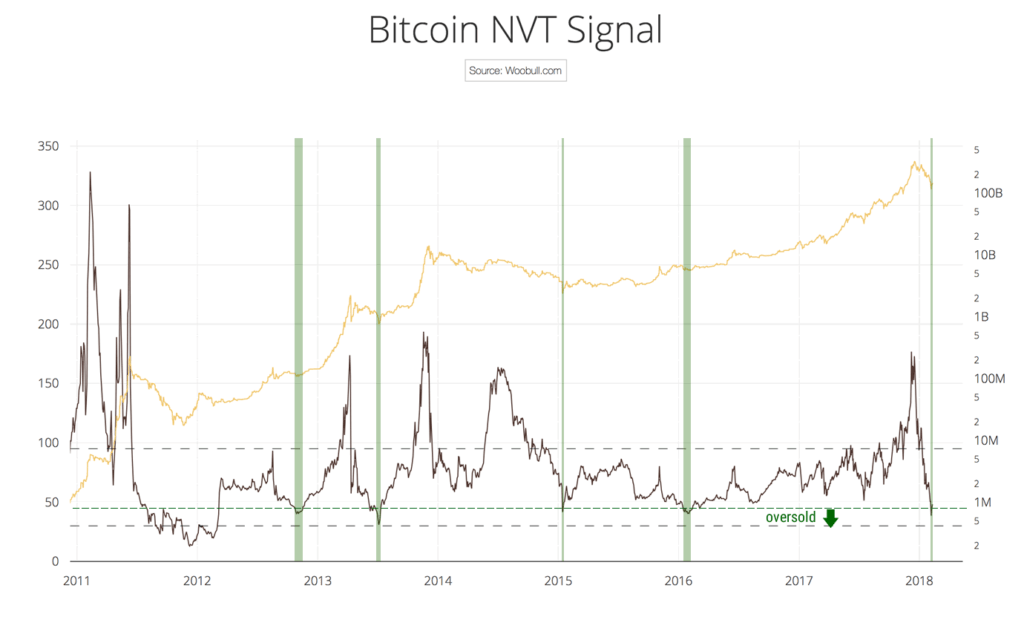
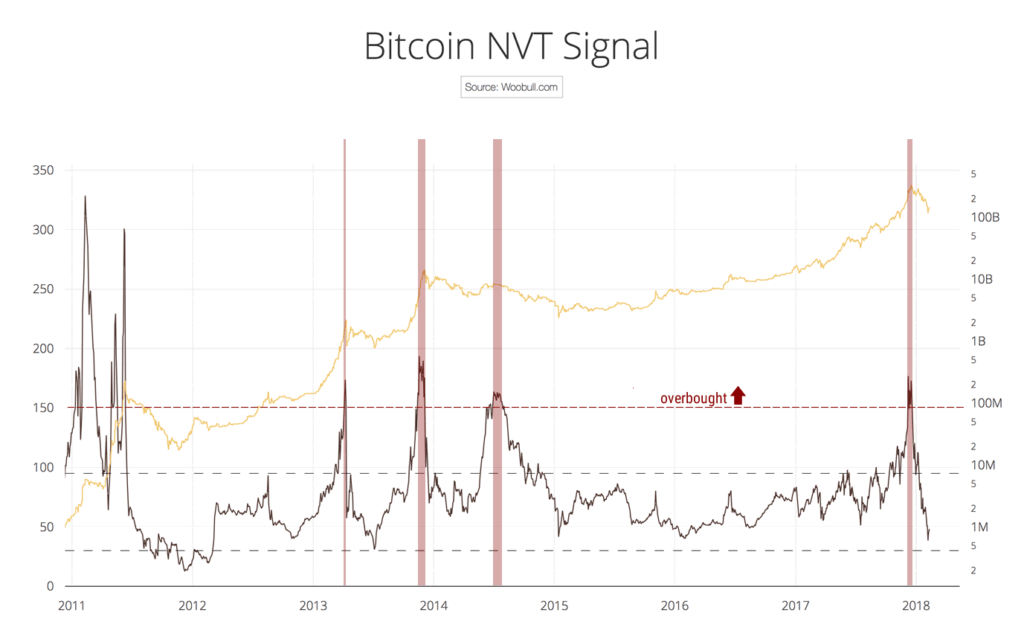
Take a look at the charts below. In the first chart a reading of 50 and below signals oversold situations, highlighted in green by Woo, while in the second chart overbought situations are shown in a reading of 150 and above. The yellow line is network value (right axis).
In distinction to the typical technical analysis used to try and anticipate price movements, which are limited by reference to historical prices and trading volumes, the NVT Signal is grounded in what is actually happening on the blockchain.
It could also be applied to other blockchains, be it Ethereum or Litecoin. It’s another bit of kit for the trader’s toolbox, and it could be the most useful yet in the technical indicator armoury because it is based on ecosystem fundamentals.
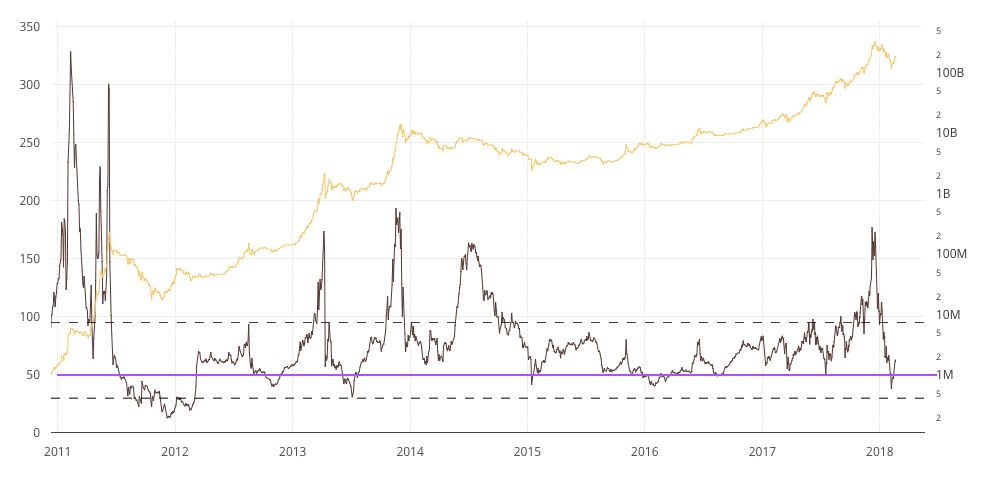
The last chart (below) with EWN annotation in purple, shows the situation today and how NVT Signal predicted the recovery in the bitcoin price. All charts courtesy of woodbull.com.


