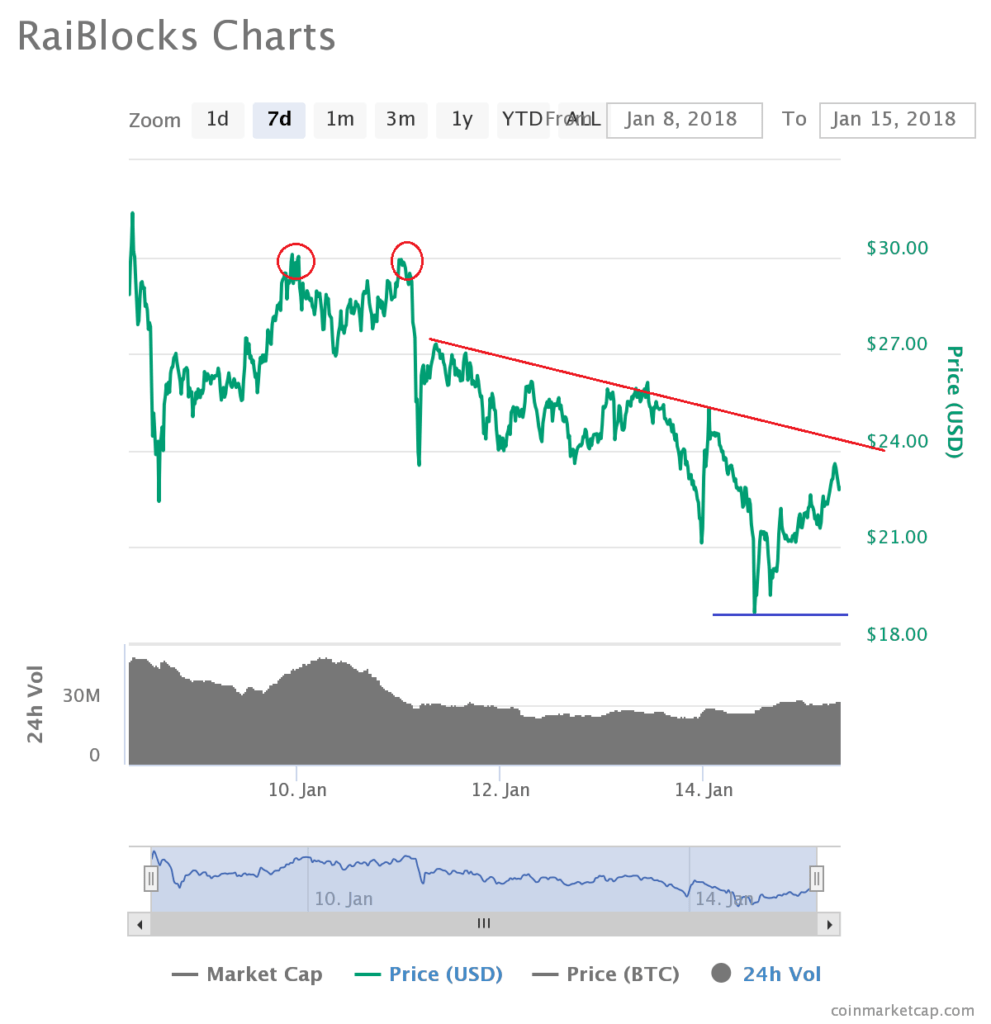
RaiBlocks price failed to stay above the $25.00 support and traded lower against the US dollar. XRB/USD is recovering, but it is facing sellers near $24.00.
Key Talking Points
- RaiBlocks price traded lower recently and formed a low at $18.98 against the US dollar.
- There is a major bearish trend line forming with resistance at $24.00 on the 7-days chart of the XRB/USD pair.
- The pair has to move above the $24.00 and $25.00 resistance levels to challenge $30.00 once again.
RaiBlocks Price Forecast
There were two rejection notes in RaiBlocks price around the $30.00 level against the US dollar. The XRB/USD pair started a fresh downside was and declined below the last major support at $25.00.
The decline was real as the price even failed to stay above the $22.00 and $20.00 support levels. It traded as low as $18.98 before starting an upside correction.
It has recovered above the $20.00 level and the 23.6% Fib retracement level of the last decline from the $30.10 high to $18.98 low. However, there are many resistances on the upside around the $25.00 level.
There is a major bearish trend line forming with resistance at $24.00 on the 7-days chart of the XRB/USD pair. The same area is also around the 50% Fib retracement level of the last decline from the $30.10 high to $18.98 low.
Therefore, it seems like there is a crucial barrier for buyers around the $24.00 and $25.00 levels. As long as the price is below the mentioned $25.00 level, it remains in a bearish zone.
A successful close above the $25.00 level could open the doors for a move towards the next major resistance at $30.00. On the downside, a key support is around the $20.00 level. Below $20.00, the last swing low at $18.98 will most likely be breached in the near term.
The technical indicators for XRB/USD are recovering, but they are still in the bearish zone.
Trade safe traders and do not overtrade!


