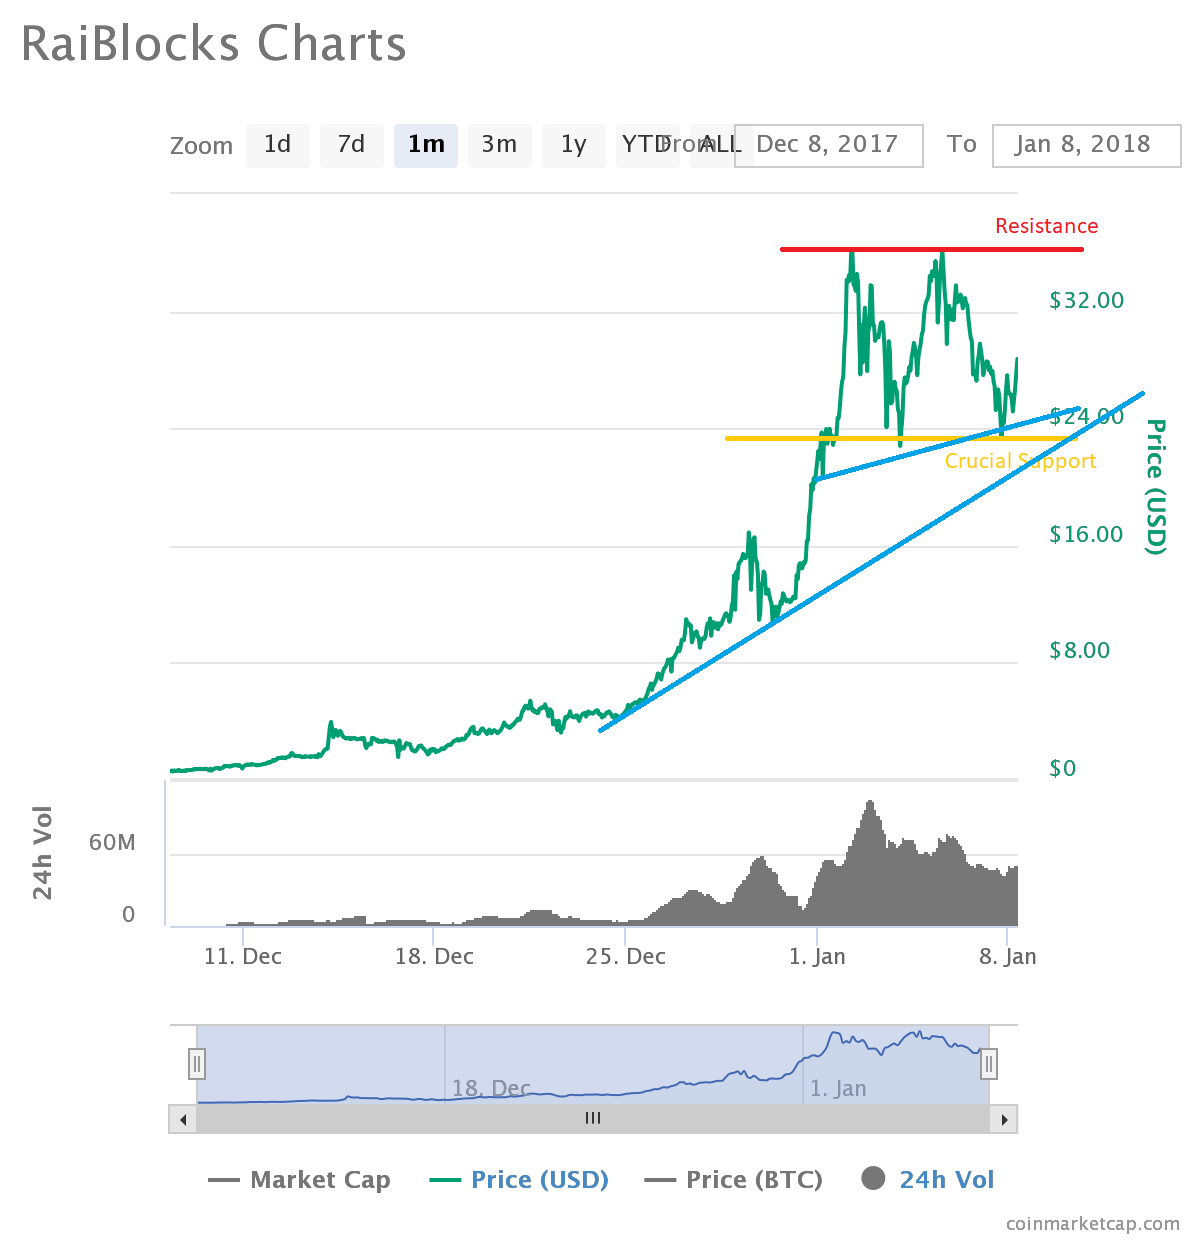
RaiBlocks price struggled to remain above the $35.00 level and moved down against the US Dollar. XRB/USD is currently testing a major support around $25.00.
Key Talking Points
- RaiBlocks price started a new downside wave after failing to stay above $35.00 against the US Dollar.
- There was a double top pattern formed around the $35.00-36.00 levels on the 1-month chart of the XRB/USD pair.
- On the downside, the pair is holding a major support area above $24.00 and is showing positive signs.
RaiBlocks Price Forecast
After a downside correction from the $36.15 swing high, RaiBlocks price tested the $23.00-24.00 support area. The mentioned area is a major support and prevented declines toward $20.00.
The XRB/USD pair bounced and moved above the $30.00 level once again. However, the upside was protected around the $35.00-36.00 resistance area. As a result, a double top pattern was formed around $36.00, which ignited another downside wave.
On the upside, the pair faces a lot of resistance levels. An initial hurdle is around the $30.00 level. Moreover, the 50% Fib retracement level of the last decline from the $36.21 high to $23.39 low is a crucial upside barrier for buyers around $30.00-31.00.
On the positive side, it seems like a monster support base forming near $24.00. There is also a connecting bullish trend line forming with support around $24.00.
Therefore, any major dips remain supported above $24.00. On the upside, a break above $30.00 could push the price back towards the $35.00 and $36.00 resistance levels. Should RaiBlocks buyers gain momentum above $35.00, there can be a test of the $40.00 handle.
The technical indicators for XRB/USD is positive on the monthly chart, suggesting an upside push.
Trade safe traders and do not overtrade!

