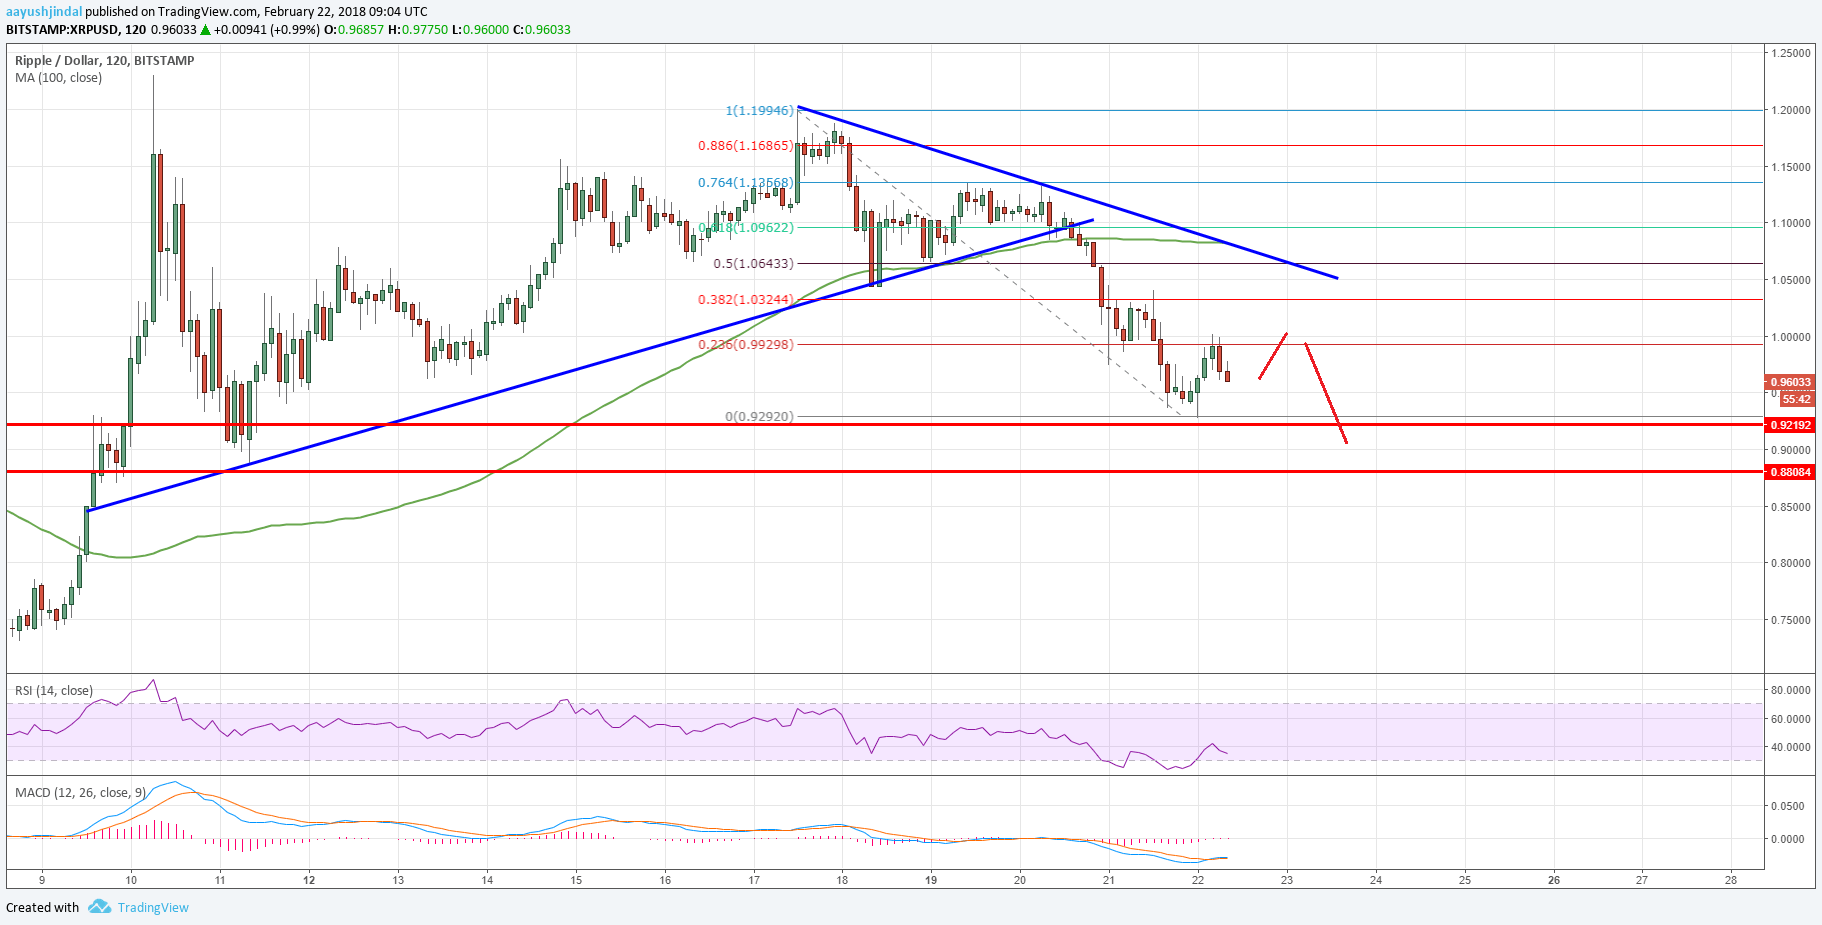
Ripple price declined recently and moved towards $0.9300 against the US Dollar. XRP/USD is currently at a risk of more declines and it could break $0.9300.
Key Talking Points
- Ripple price started a downside move from the $1.1994 swing high against the US Dollar.
- There was a break below a major bullish trend line with support at $1.108 on the 2-hours chart of the XRP/USD pair (Data feed via Bitstamp).
- The pair is currently under pressure and it may decline further below the $0.9300 level.
Ripple Price Forecast
There was a short-term top formed in Ripple price above the $1.1900 level against the US Dollar. The XRP/USD pair formed a high at $1.1994 and started a downside move. It declined and traded below the $1.10 and $1.04 support levels.
The price is now trading well below the $1.00 level and the 100 simple moving average (2-hours), which is a bearish sign. It also moved below the $0.9600 support and traded close to the $0.9250 level.
During the downside move, there was a break below a major bullish trend line with support at $1.108 on the 2-hours chart of the XRP/USD pair. The pair traded as low as $0.9292 and it is currently correcting higher.
It seems like the pair struggled to even move above the 23.6% Fib retracement level of the last drop from the $1.1994 high to $0.9292 low. It means that the price may now correct further and it could retest the $0.9292 low.
If the price continues to decline, it could even break the $0.9292 low and trade below $0.9200. The next major support is the mentioned case would be $0.9100. Below $0.9100, the price may even retest the $0.9000 level.
On the upside, the $0.9950 level is a key resistance. However, the most important resistances are at $1.02 and $1.05. Both levels were supports and now they may perhaps stop upsides above $1.05. Overall, the current structure is bearish as long as the price is below $1.05.
Trade safe traders and do not overtrade!


