Ripple price found support near the 0.000085BTC level against bitcoin. XRP seems to be now setting up for a bullish break above 0.000092BTC resistance.
Key Talking Points
- Ripple price is trading nicely above the 0.000085BTC support support against bitcoin.
- XRP/BTC is about to break a major declining channel with resistance at 0.000091BTC on the 2-hours chart (Data feed via Binance).
- More upsides are likely once there is a break and close above 0.000092BTC.
Ripple Price Analysis
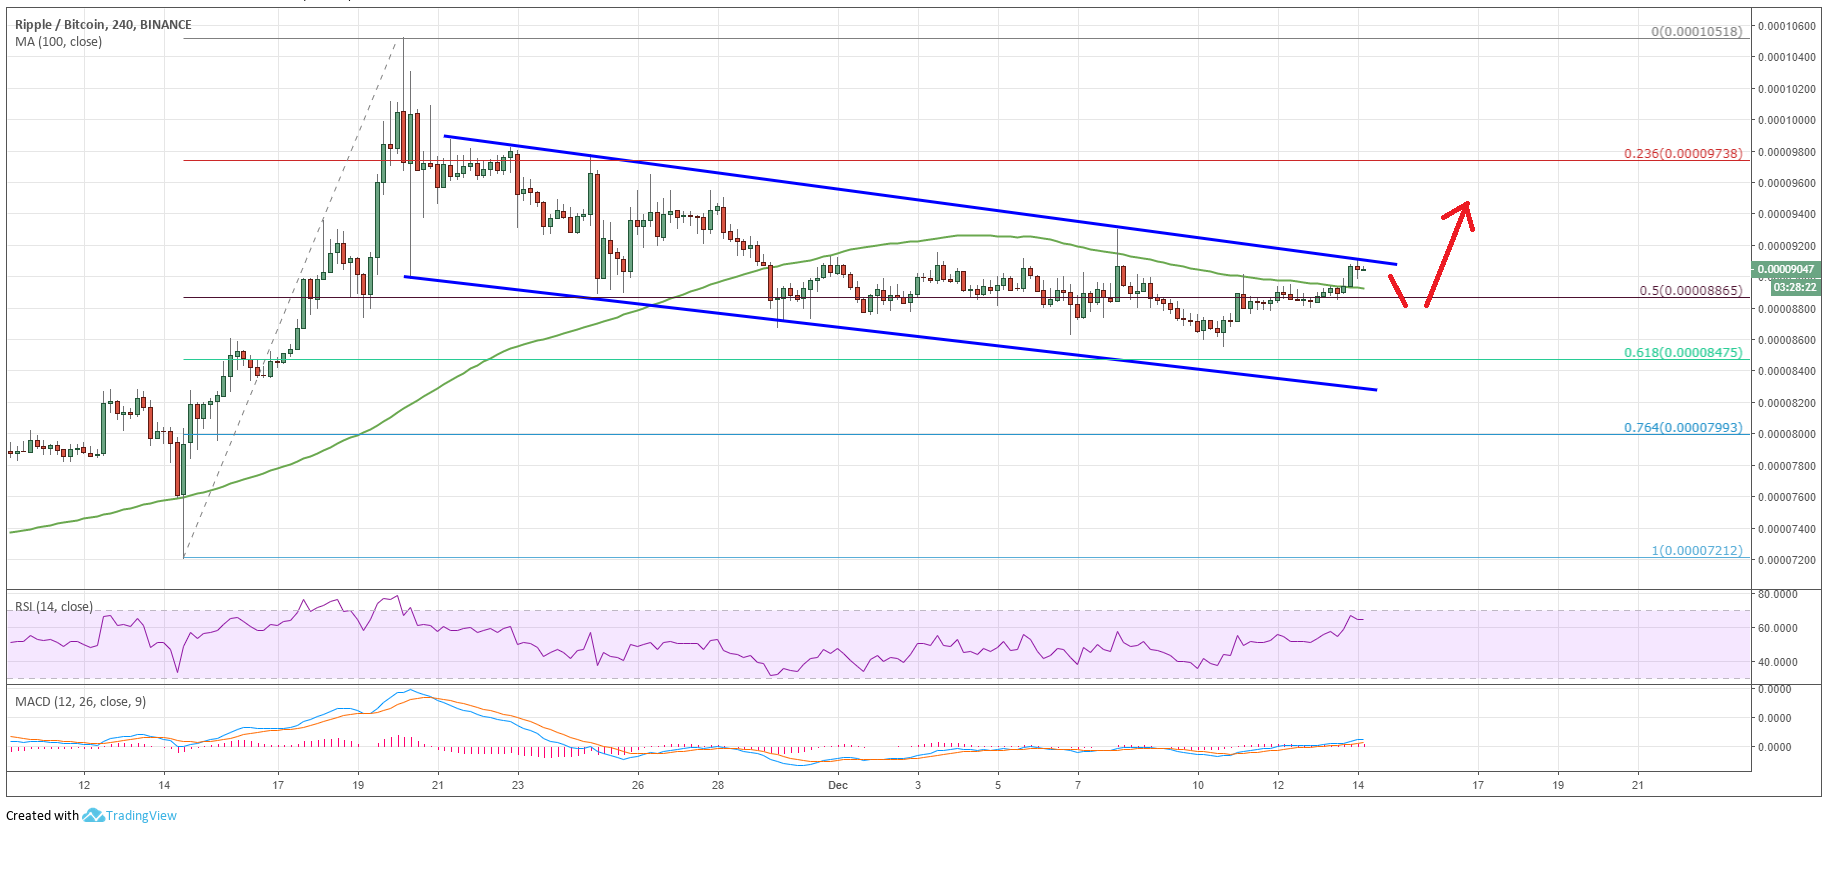
This past month, there was a sharp upward move from the 0.000072BTC low in ripple price against bitcoin. XRP to BTC surged higher and broke the 0.000090BTC and 0.000100BTC resistance levels.
Looking at the chart, the price traded towards the 0.000105BTC level and later started a downside correction. The price declined below the 0.000090BTC level and the 100 simple moving average (4-hours).
There was a break below the 50% Fib retracement level of the last wave from the 0.000072BTC low to 0.000105BTC high. However, losses were protected by the 0.000085BTC support area and later buyers took control.
Moreover, there was test of the 61.8% Fib retracement level of the last wave from the 0.000072BTC low to 0.000105BTC high. The price is currently moving higher and it is currently trading near the key 0.000091BTC and 0.000092BTC resistance levels.
Moreover, there is a major declining channel in place with resistance at 0.000091BTC on the 2-hours chart. Therefore, a successful break above the 0.000091BTC and 0.000092BTC resistance levels will most likely clear the path for more gains towards the 0.000100BTC and 0.000105BTC levels in the near term.
Overall, ripple price seems to be approaching a crucial upside break if buyers gain strength above the 0.000091BTC level. On the downside, the key supports are at 0.000088BTC and 0.000086BTC. On the other hand, XRP to USD is at a risk of a downside break if buyers fail to push the price above the $0.3250 resistance level. The main supports are positioned near the $0.2920 and $0.2850 levels.
The market data is provided by TradingView.


