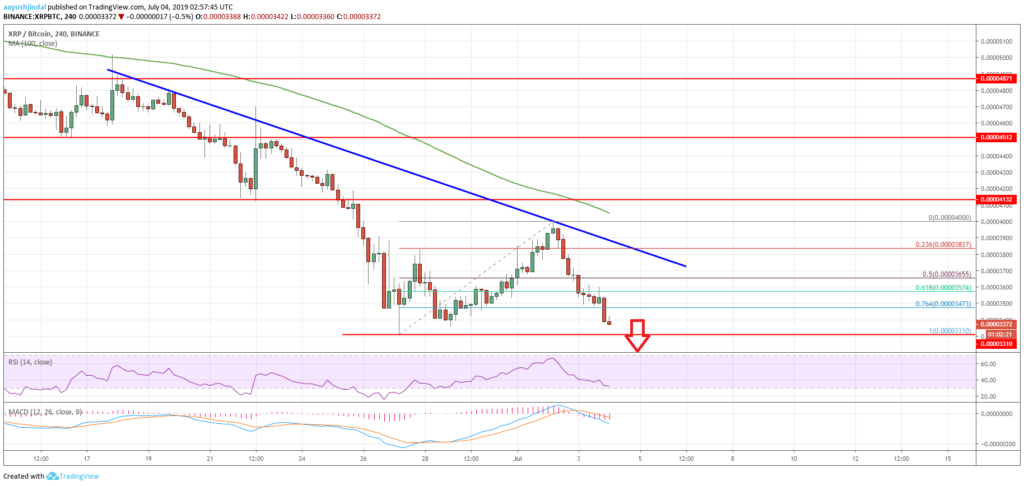
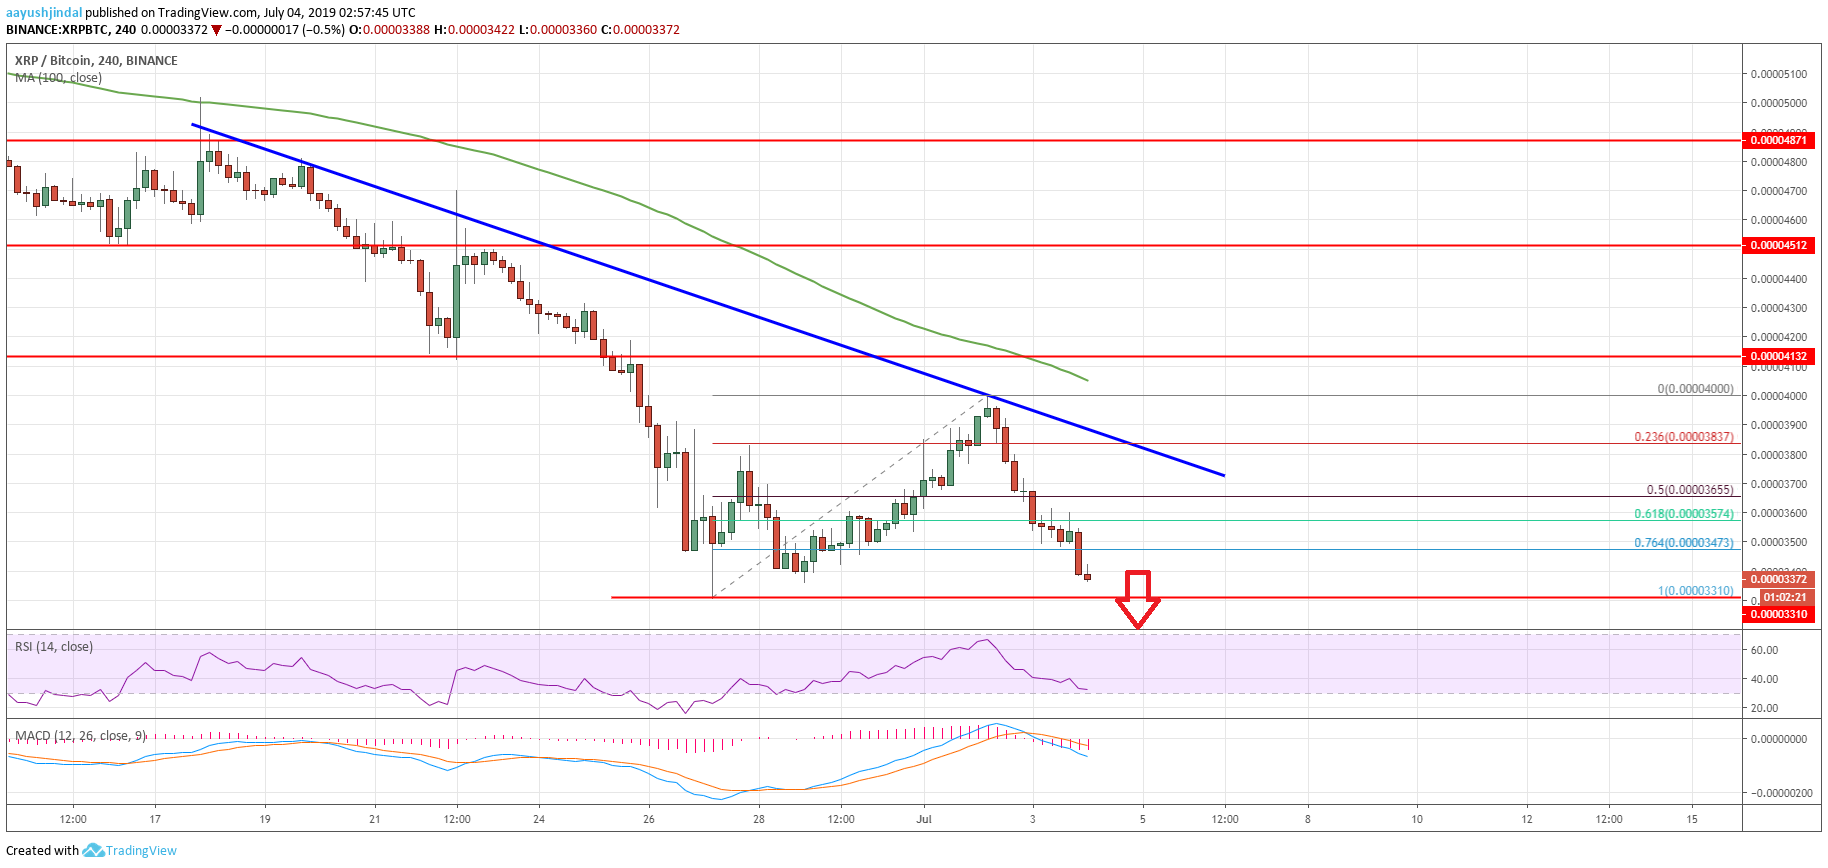
Ripple price failed to climb above the key 0.00004000 resistance against bitcoin, and declined recently. XRP is currently under pressure and it could decline further vs BTC in the near term.
Key Talking Points
- Ripple price topped near the 0.0000400 resistance and trimmed gains against bitcoin.
- There is a crucial bearish trend line forming with resistance near 0.0000380BTC on the 4-hours chart of XRP to BTC (Data feed via Binance).
- The price is currently approaching the 0.0000330BTC support, below which it could nosedive.
Ripple Price Analysis
After trading as low as 0.0000331, ripple price started an upside correction against bitcoin. XRP broke the 0.0000380BTC resistance, but it failed to climb above the key 0.0000400 resistance level.

Looking at the chart, the price topped near the 0.0000400 resistance and recently started a fresh decline. It broke the 0000380BTC support level to enter again into a bearish zone. More importantly, it stayed well below the 0000400BTC level plus the 100 simple moving average (4-hours).
There was a clear break below the 50% Fib retracement level of the last wave from the 0.0000331BTC low to 0.0000400BTC high. It opened the doors for more losses below the 0000360BTC support area.
The price is now trading below the 76.4% Fib retracement level of the last wave from the 0.0000331BTC low to 0.0000400BTC high. It seems like the price may soon revisit the last swing low at 0000331BTC in the near term.
If there is a downside break below the 0000331BTC support, ripple price might continue to slide. It could even test the main 0000300BTC support area in the coming days.
On the upside, there are many hurdles near the 0000360BTC, 0000380BTC and 0000400BTC levels. There is also a crucial bearish trend line forming with resistance near 0.0000380BTC on the 4-hours chart of XRP to BTC.
Therefore, ripple price must close above the trend line, the 100 simple moving average (4-hours), and the 0000400BTC resistance level to start a decent recovery in the near term. If XRP continues to struggle below 0000400BTC, there is a risk of more downsides.
The market data is provided by TradingView.

