Tron price corrected lower this past week after a monster rally to $0.0350. TRX tested the $0.0220 support, bounced back, and it could now accelerate to $0.0300 or $0.0320.
Key Talking Points
- Tron price found support near $0.0220 and bounced back (Data feed of Binance) against the US Dollar.
- There was a break above a crucial bearish trend line with resistance at $0.0230 on the 4-hours chart.
- TRX price is back in an uptrend and it may continue to grind higher towards $0.0280 and $0.0300.
Tron Price Analysis
In the last analysis, we saw a nasty upward move in tron price above $0.0300 against the US dollar. The TRX/USD pair did test the $0.0350 zone and later started a sharp downside correction.
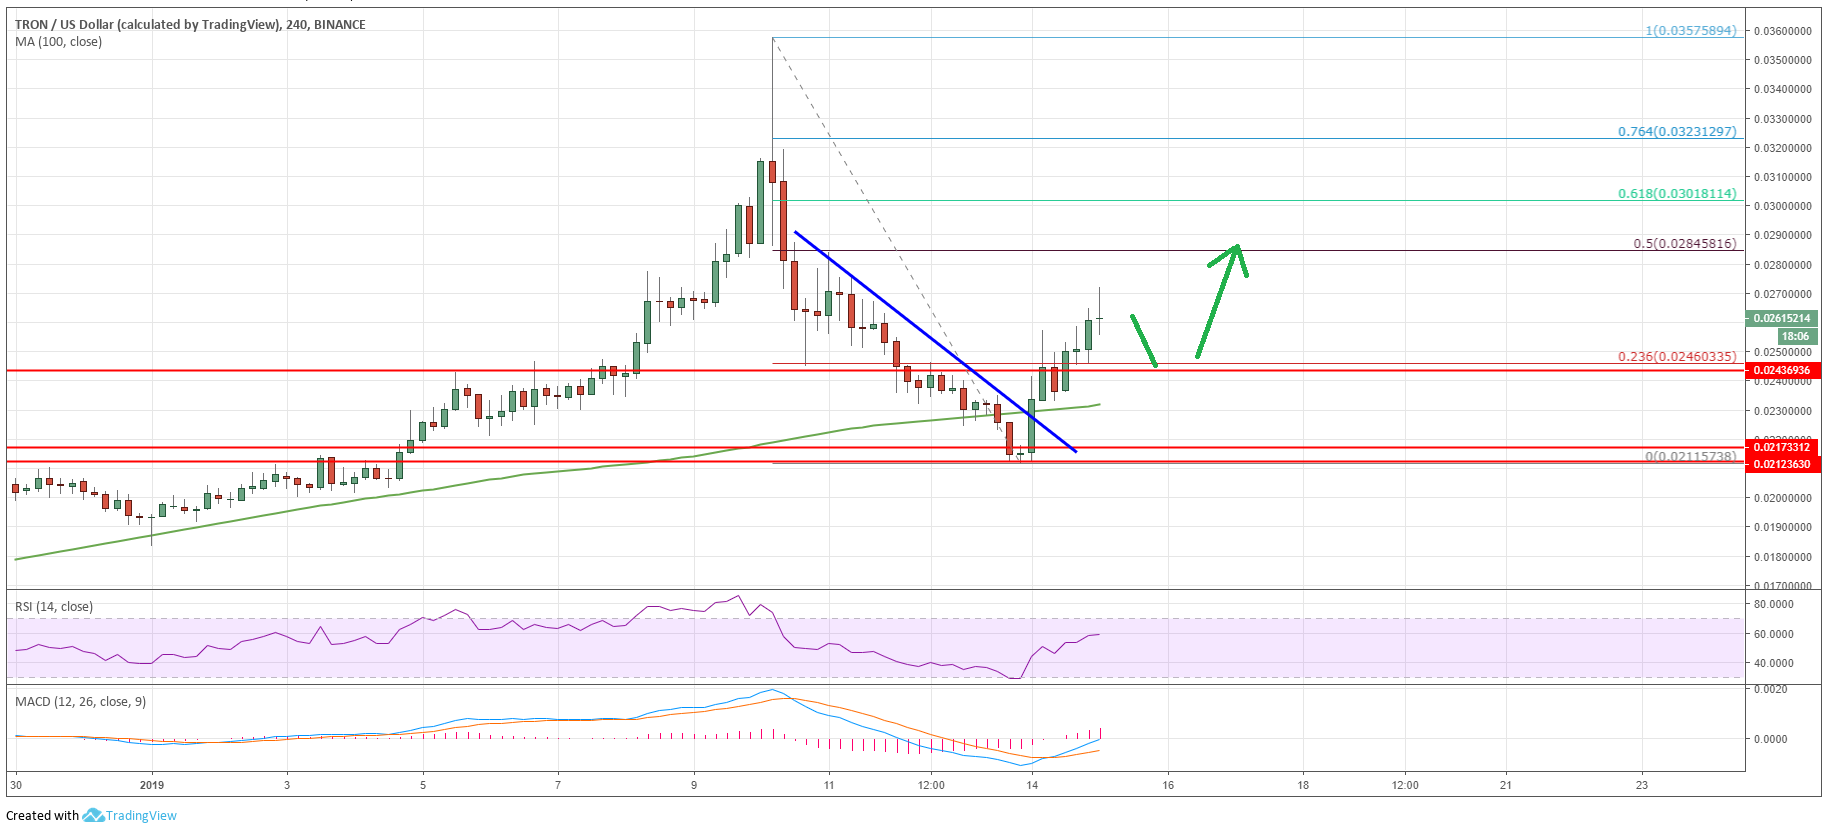
Looking at the chart, TRX price declined heavily from the $0.0357 swing high and traded below the $0.0300 and $0.0250 support levels. However, the previous pivot area near $0.0220 acted as a solid support and prevented further losses.
A low was formed at $0.0211 and later there was a decent upside reaction. Buyers cleared the $0.0230 resistance and the 100 simple moving average (4-hours). Besides, there was a break above the 23.6% Fib retracement level of the last crucial decline from the $0.0357 high to $0.0211 low.
More importantly, there was a break above a crucial bearish trend line with resistance at $0.0230 on the 4-hours chart. The price gained traction above the $0.0240 level and it traded close to $0.0270.
The current price action indicates that the price is back in a positive zone above $0.0230. The next stop for buyers could be $0.0284. It represents the 50% Fib retracement level of the last crucial decline from the $0.0357 high to $0.0211 low.
Overall, TRX buyers are back in action and it seems like there could be more gains towards $0.0280 and $0.0300 in the coming days. Conversely, if there is a downside correction, tron is likely to find a strong buying interest near the $0.0250 and $0.0240 support levels, below which the next stop is the 100 SMA (4-hours).
The market data is provided by TradingView.


