Dash price is following a declining channel below $380 against the US Dollar. BTC/USD needs to clear $320 to gain upside momentum.
Key Talking Points
- Dash price is slowly moving lower and recently traded below the $300 level (data feed by Kraken) against the US Dollar.
- There is a crucial bearish trend line forming with resistance at $320 on the 4-hour chart of DASH/USD.
- The pair has to surpass the trend line resistance at $320 and the 100 SMA (H4) to gain upside traction.
Dash Price Chart Analysis
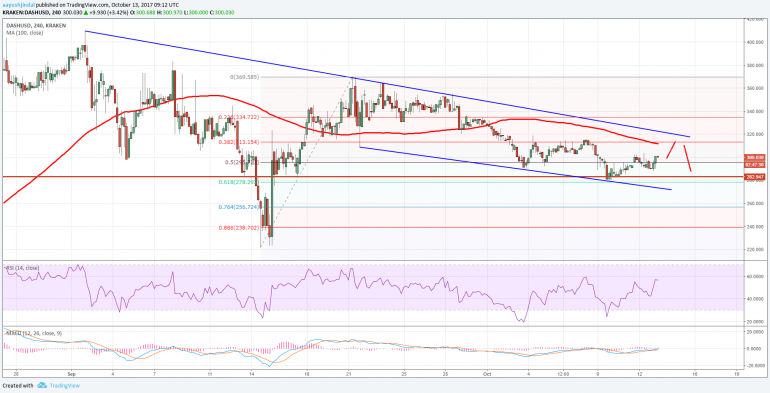
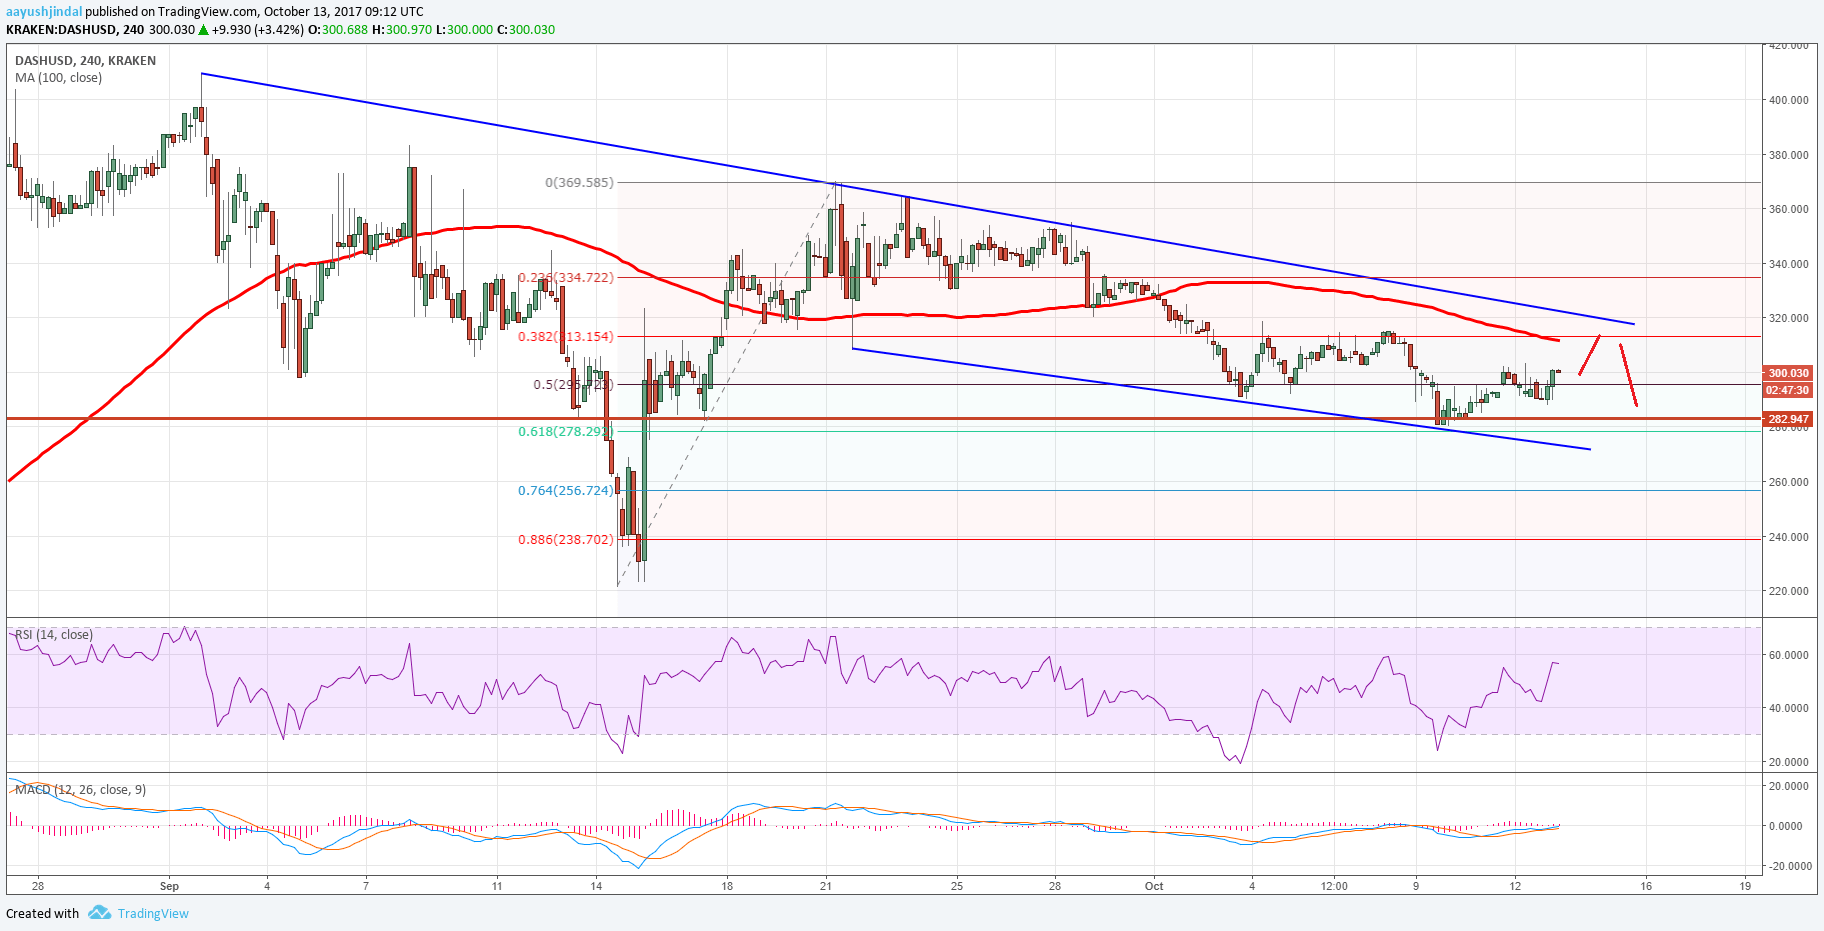
The recent upside surge in bitcoin price above $5000 has increased selling pressure on altcoins including Dash since its price moved below $300 against the US Dollar. The price started a downside move from $369 and recently tested the $280 support zone.
There was even a break below the 50% Fibonacci retracement level of the last wave from the $221 low to $369 high. Sellers even succeeded in pushing the price below the 100 simple moving average (4-hour).
At the moment, the price is recovering from the 61.8% Fibonacci retracement level of the last wave from the $221 low to $369 high. Therefore, there is a chance of it moving back towards the $310-320 levels.
However, there is a crucial bearish trend line forming with resistance at $320 on the 4-hour chart of DASH/USD. The 100 SMA (H4) is at $313 to prevent an upside break in the near term.
As long as the pair is below the trend line resistance and $320, it won’t be easy for buyers to contain losses below $300. On the downside, a break and close below $280 could trigger a downside reaction towards $260-250.
One positive is the fact that the H4 RSI is well above the 50 level and is showing bullish signs. If the current buying interest picks up, there can be an attempt to surpass the $320 resistance.
In the short term, one can consider trading ranges with resistance at $320 and support at $280.
Trade safe traders and do not overtrade!


