Latest Ripple News
As we mark the 10th anniversary since the elusive Satoshi Nakamoto first published Bitcoin’s white paper, we shift our attention to price. Price is a useful metric. But it is not everything. Among other things, usage takes priority. That’s not rocket science but just application of Metcalfe’s network effect. When prices peaked at the height of 2017 unprecedented rally, it was a windfall for XRP, BTC and all early coin investors.
However, nobody in their wild thoughts could have anticipated BTC prices to fly from cents to an eye-popping $20,000. Fortunately, it did and now the bar has been set high. But, even as the community remain doubtful, XRP and BTC are amongst the first coin in this sphere. BTC solves cross-border issue but is slow and didn’t get the approval during Phase 1 of Bank of Canada’s Project Jasper. On the other hand, XRP, the coin that powers Ripple solutions is super-fast, reliable and settles almost instantaneously.
Bitcoin took 7 years to grow to $20,000 from $0.003. XRP won’t take nearly as long to hit $500 because;
1. XRP isn’t stagnant, Ripple has done more to grow the XRP ecosystem in the past 12 months than Bitcoin has achieved since its inception.
2. Bakkt & Fidelity#xrp
— ElonTrades (@ElonTrades) October 30, 2018
Therefore, as a coin that has real utility, XRP perma-bulls are projecting a $500-$1000 price tag in years to come. In fact, this is not the first time +$500 valuation is sprouting. So, while it may be outrageous for now remember BTC rose from $0.003 to $20,000. Likewise, there is absolutely nothing that can prevent XRP from erupting from $0.45 to $500.
XRP/USD Price Analysis
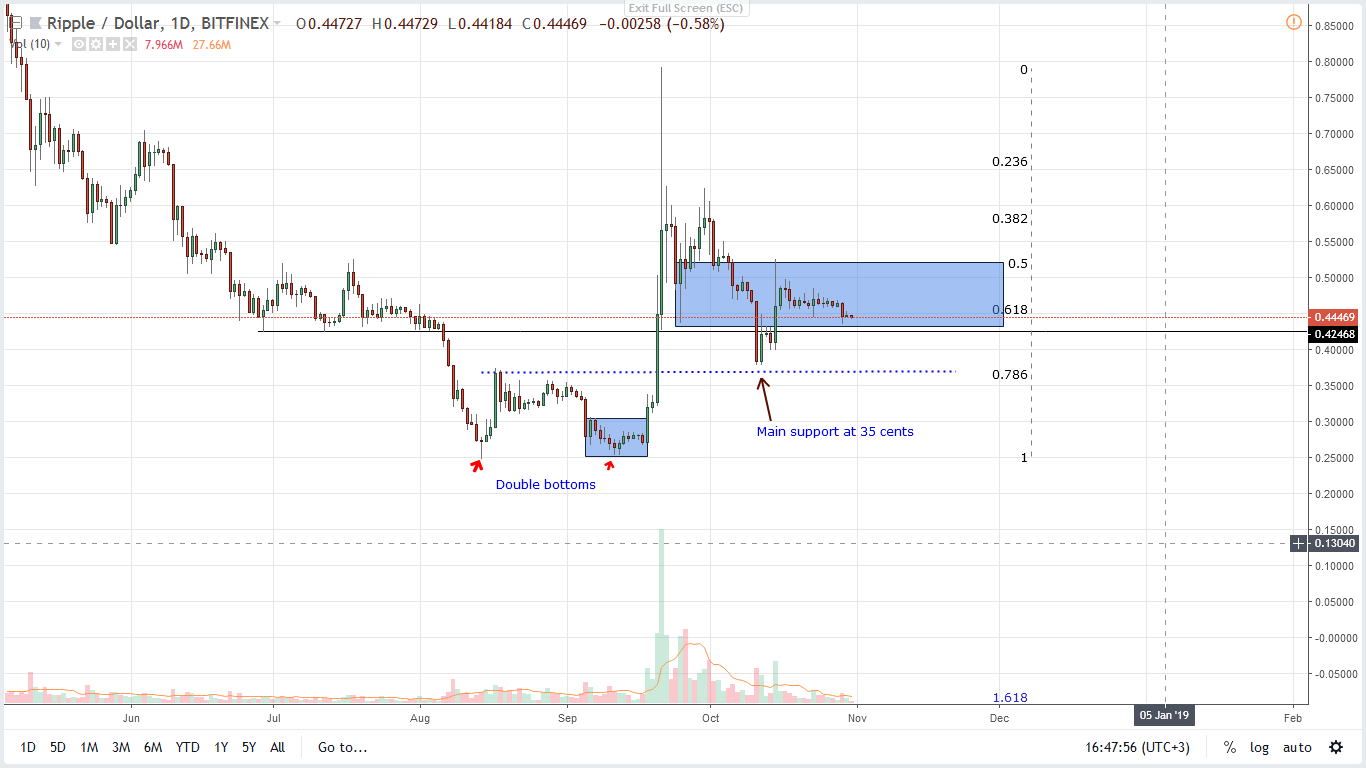
There is stability in XRP/USD and this is normal especially after periods of high volatility as those of late September. XRP is down four percent in the last week and pretty unmoved in the last day.
Trend: Bullish
Because of the disruption of trading patterns following Sep 18-23 XRP surge, it doesn’t make sense to draw trend lines and similar shapes. First, it’s clear that XRP/USD is bullish. As visible from the charts, prices are trending inside week ending Sep 23. Besides the bull break out, prices are trending above our main support zone at around 35 cents to 40 cents meaning the underlying momentum is bullish.
Volumes: Decreasing but low Bear volumes
In this time frame, conspicuous volumes are those of Sep 21 at 751 million, Oct 11 at 150 million and Oct 29 at 42 million. The trend is simple to see. Volumes are declining but this is a correction and nothing else. For cancellation of our upbeat preview, a high-volume bar must first break and close below the lower limit of our support at 35 cents. Conversely, for trend resumption, we must see strong break outs above 50 cents as price action fade Oct 29 events.
Candlestick Formation: Breakout Pattern
Events of late Sep did print a bull breakout trade pattern. In fact, bulls did clear several resistance levels as XRP prices tripled peaking at 80 cents. Therefore, since the trend is set, a Fibonacci retracement tool on Sep high low reveal that prices are ranging within traditional reversal points at 40 cents and 50 cents. This mesh well with the 50 percent Fibonacci level (50 cents) and 78.6 percent Fibonacci retracement level (40 cents).
Conclusion
Save the market sentiment, XRP/USD pair is technically bullish following Sep 18-23 high volume break outs. Besides, from a top down approach, prices are down +80 percent from 2017 peaks and are within historical reversal levels when we use Fibonacci retracement as an entry tool. Combining this with favorable candlestick formation with strong fundamentals, it’s likely that XRP/USD will recover this quarter.
All Charts Courtesy of Trading View
This is not trading advice. Do your own research.


