Recently, Bitcoin and Gold proponents have been crashing on which is best suited to be a store of value. Unfortunately, Bitcoin has been on the receiving end due to its wide price fluctuations. But, as it turns out, the volatility aspect will soon be out of the way since Bitcoin is slowly but consistently becoming stable and will match Gold’s volatility within the next 10 years.
Major culprits in Bitcoin’s volatility woes are low liquidity and market cap which at the time of writing stands at $140.7 billion relative to Gold’s at more than $7 trillion. Additionally, unclear regulatory control, fundamental development as well an unequal distribution are to blame for Bitcoin’s volatility.
Blocktown Capital, a digital asset manager, noted:
“Bitcoin volatility continues to decrease and approaches the volatility of Gold over the past 8 years. At the current rate, Bitcoin’s volatility will match that of Gold in a decade.”
Any Statistical References?
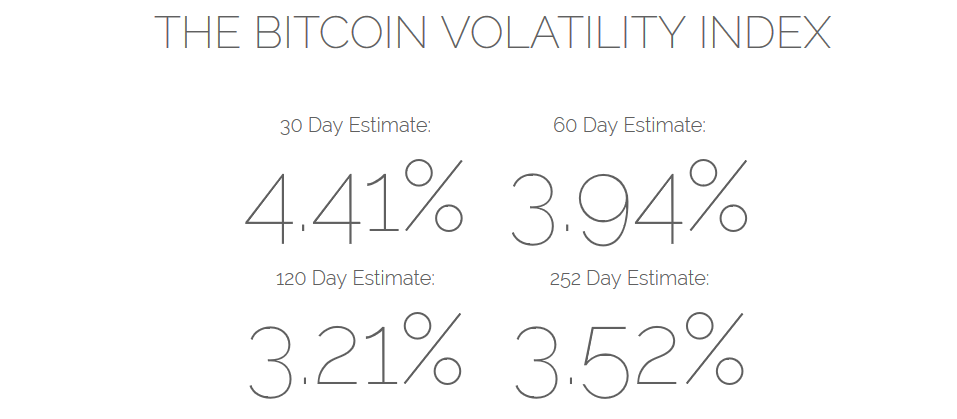
From a statistical standpoint, the Bitcoin volatility index is indeed decreasing. For instance, a 30-day estimate shows that the top coin’s volatility will be at 4.41 percent, followed by 3.94 percent on a 60-day estimate. Additionally, a 120 and 252-day estimate records the Bitcoin volatility index at 3.21 percent and 3.52 percent respectively.
When compared to Gold, from July 2011 to September 2018, Bitcoin has been moving towards closing the volatility gap. However, the difference was thinnest between July 2015 and early 2017, after which it continued to widen towards the end of 2017. It has since started dropping.
Volatility of Oil, US Real Estate, And US Stocks
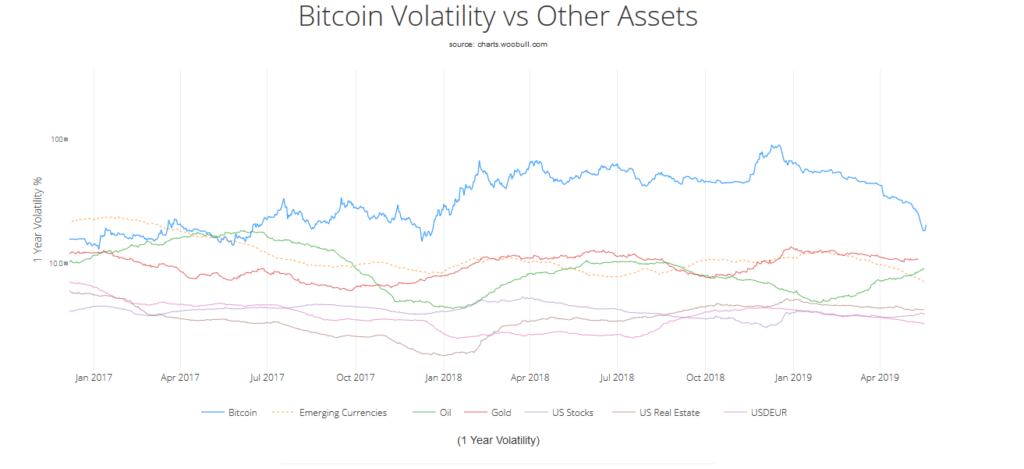
Apart from extrapolating the Bitcoin-Gold volatility relationship, comparing Bitcoin with other assets such as oil, US stocks, and US real estate brings out the same picture.

For example, pitting oil and Bitcoin from 2012 to 2019 shows that the volatility gap between the two assets has been narrowing and was at its closest between the end of 2015 and towards the end of 2017. The gap widened in 2018 but its narrowing to reach 2016/2017 levels when oil had a volatility of 13.4 percent and Bitcoin stood at 15.4 percent. Currently, oil is at 9.10 percent while Bitcoin is at 18.3 percent. Gold is at 10.9 percent, while US stocks are at 3.90 percent, US real estate at 4.22 percent, and emerging currencies have a volatility index of 7.17 percent.
Out of the seven assets, only Gold, oil, and emerging currencies have volatility levels comparable to that of Bitcoin.
An annualized historical volatility index provided by BitMEX, a leading virtual currency exchange, indicates that Bitcoin’s volatility has been ranging between 25.64 percent and 78.30 percent from April 1, 2019, to May 20, 2019.
But What of the Golden Cross?
Unfortunately, the volatility may continue to increase instead of decreasing if the ‘Golden cross’ is to be followed. By definition, a Golden Cross is formed when a shorter-term moving average (MA) (e.g., 50-day) crosses above a longer-term moving average (e.g., 200-day MA). The Golden cross phenomenon is mostly used in technical analysis to anticipate the next route Bitcoin will take. Although analysts are divided as to how to interpret such a formation, some view a Golden cross as a sign of massive volatility.
As B. Biddies, a Twitter user, noted last month:
“BTC Golden cross trajectory now April 24. (Was previously April 25). Should be interesting. A lot of hype that is the ‘bull run’ signal. If I were a bear or bull whale, that’s when I’d strike. Bull whale rides momentums of GC traders. Bear whale destroys their morale.”


