Bitcoin Rallies Hard Past $9,300
And just like that, Bitcoin (BTC) is right back above $9,000. The past 72 hours have been absolutely stellar for the crypto market, as it saw all digital assets gain notably across the board. BTC, most notably, moved from the low-$8,000s, where analysts expected heavy resistance, to $9,150 where it stands right now.
With this, the bullish cries of traders all across the industry have returned, despite the fact that they were calling for a massive pullback just weeks earlier. And more importantly, some have begun to claim that a massive move higher is still on the horizon.
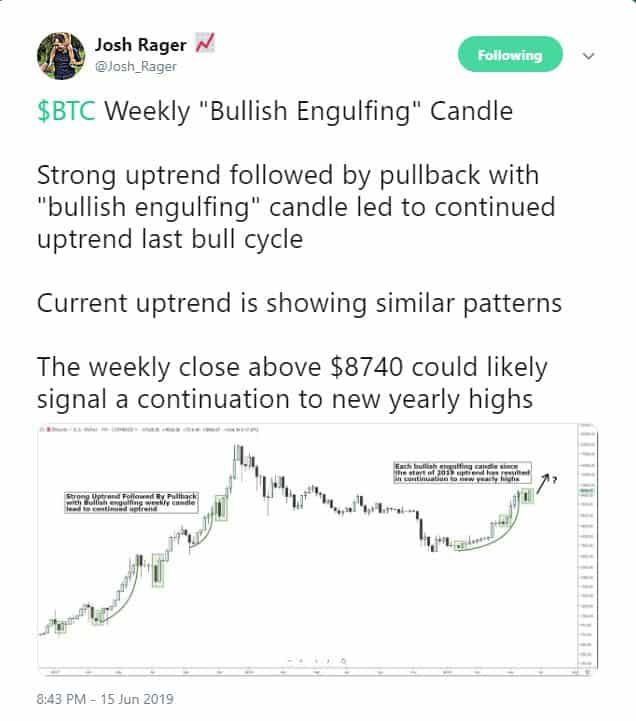
In a recent tweet, prominent analyst Josh Rager, who has risen to prominence amid the crypto bear market of 2018, remarked that Bitcoin’s weekly chart is currently experiencing a massive “bullish engulfing candle”. This means that last week’s losses, which saw BTC fall from $8,800 to briefly tap $7,450, have been reversed, barring that we don’t close under $8,800 at 0:00 UTC on June 17th.

Rager claims that this pattern, which includes a strong pullback (black candle) and a subsequent bullish reversal (engulfing white candle), is what “led to continued uptrend last bull cycle.” Thus, he notes that if Bitcoin manages to finish this week strong, and not scale back by the 3% or 4% to $8,750, he will be convinced that BTC will continue on to post new yearly highs in the coming weeks and months. Analyst Nunya Bizniz pointed out this pattern exact too.
But where is that exactly? According to analyst Credible Crypto, BTC’s next stop would be in the high-$9,000s and low-$10,000s, which is where the next line of heavy resistance lies.
$10,000 is where BTC topped in last years’ bear market rallies, and where the asset found heavy resistance on its way up during the legendary 2017 boom.
Bulls on Parade
Regardless of what exactly plays out over the next few days, many are sure that a bull run is surely on. Rager recently noted that the Super Guppy, an indicator that singles out overarching trends, has flipped from red to grey on Bitcoin’s one-week chart after it flipped from grey to green on Bitcoin’s three-day chart. This occurred when BTC pushed past $7,000 just weeks ago. While the one-week Super Guppy isn’t green yet, signaling a clear uptrend, Rager notes that Guppys are “lagging indicator”, meaning that the change from red to interim grey makes for a “strong confirmation” of a bull trend.
This isn’t the only confirmation of a bull trend that BTC has recently seen. Per Josh Olszewicz, an analyst at Brave New Coin, the 100 exponential moving average (EMA) and 100 daily moving average (SMA) on Bitcoin’s daily resolution has only crossed six times in BTC’s history as a liquid asset. Most recently, BTC’s 100 EMA has crossed above its 100 SMA, a “bull cross” according to Olszewicz. The last time this technical signal came to fruition (late-2015, pre bull run), BTC rallied parabolically in the months that followed, peaking at $20,000 as we know well know.
And most importantly, Bitcoin recently closed its fourth consecutive weekly candle above its 50-week moving average, a series of events that have never failed to mark a bull run in the past.
Title Image Courtesy of Pixabay

