Latest Tron News
Blockchain projects are open source and with Bitcoin setting the pace, they should technically be faceless. In fact, at one point, Justin said the unique properties of Bitcoin is what made him to venture into cryptocurrencies launching Tron last year. While this is welcomed, Tron and others as Ethereum and EOS with Vitalik and Dan marketing their respective mission and vision statements, most are not faceless and under the guidance of these figure heads.
#TRON has established a partnership with NeoWorld. The cooperation between both parties will revolve around entering NeoWorld, planning the NeoWorld Exclusive Island, strengthening the cooperation within the community ecosystem, etc. #TRX $TRX https://t.co/s6BAjL3DpE pic.twitter.com/KvSOjBrchT
— Justin Sun🌞 (@justinsuntron) November 8, 2018
Needless to say, Justin is a key player if not a crypto celebrity. He on several cases has been criticized for hyping important milestones but still, the platform’s achievement cannot be brushed off. Straight from partnering with Neo World, a multiplayer online virtual reality world that run off the blockchain to TRX at IndaCoin, a London based exchange, TRX stars are sparkling.
#TRON reaches over 12 million smart contract triggers in two weeks since we launch smart contract! Next milestone in the end of 2018, 50 million! #TRON #TRX $TRX pic.twitter.com/o8yOSvZx2I
— Justin Sun🌞 (@justinsuntron) November 8, 2018
But that is not the only thing. After all, there is progress with no delays in milestones.
Confirmed ✍🏽#TRON just beat the top FOUR cryptos $BTC $ETH $XRP & $BCH combined daily transaction volume 👇🏽
Nov 7#BTC: 293,604#ETH 564,602#XRP: 193,540#BCH: 22,252
= 1,073,998 Total Txs#TRX: 1,183,155 TxsTron is Built to be Used – not only Traded#IAmDecentralized$TRX pic.twitter.com/hjPPqEJYrw
— Misha Lederman (@mishalederman) November 8, 2018
It appears that most Tron based gambling dApps are outperforming drawing in users who in turn transacts on the network. Tron Dice alone has paid out millions in payment generating millions in TRX related transactions. That’s not all, two weeks after launching their own smart contracting platform, there has been 12 million smart contract triggers but the intention is to smash the 50 million level by end the year.
TRX/USD Price Analysis
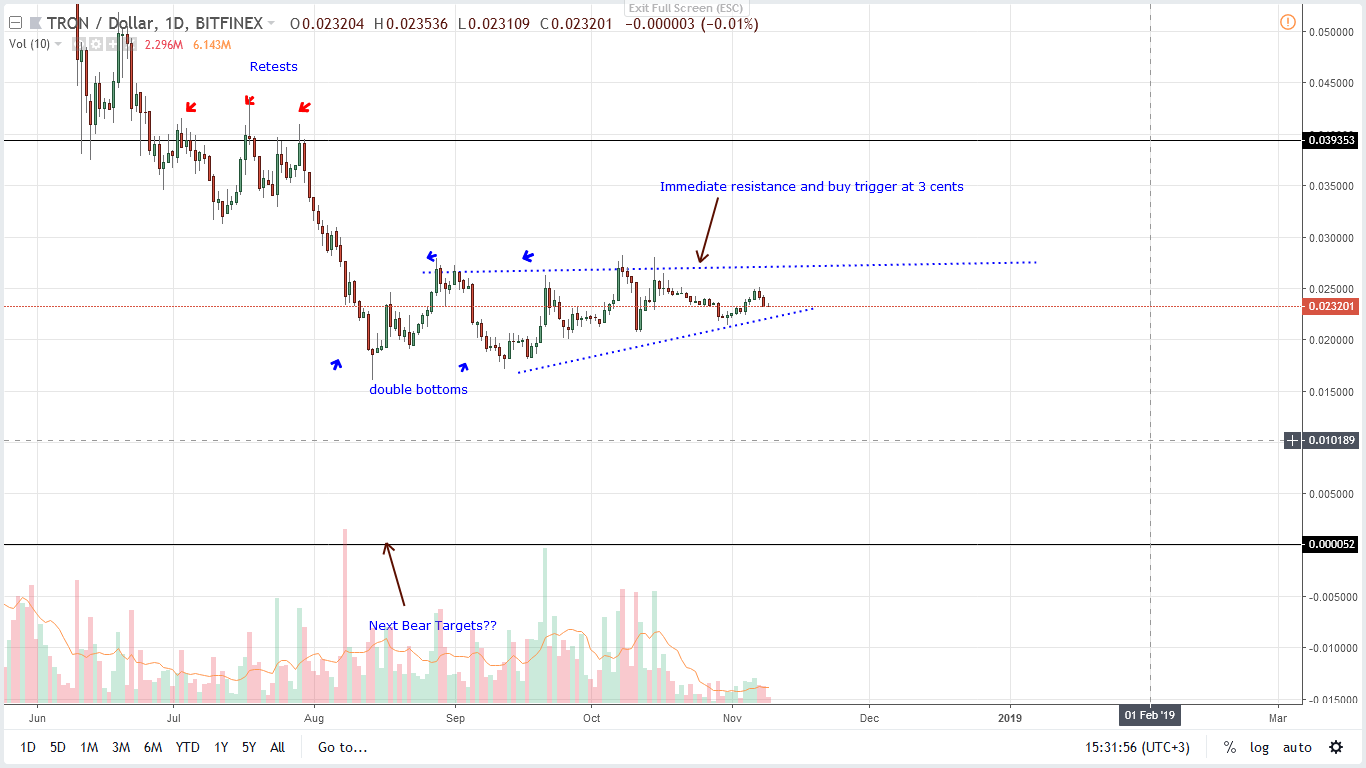
As the week concludes, the slow down is clear. In fact, TRX/USD is down 3.2 percent in the last week but down three percent in the last day. From fundamental and technical considerations, it’s likely that prices will print lower despite strong fundamentals supportive of price. But, unless otherwise, we retain a bearish forecast until after prices edge past key resistance levels.
Trend: Bearish
Recent higher highs seem to have been an opportunity for sellers to add on to their shorts as we can see with TRX/USD losses of the last few days. Still, TRX is bearish and that is despite losses of the last 10 months which have led to prices tanking upwards of 80 percent. Though prices seem to edging higher, it is actually trending inside early August bears.
Volumes: Neutral but Decreasing
In the last month, Oct 11 and 15 counter bars are important and anchor our analysis. First, note that TRX/USD is inside a 0.8 cents range with resistance at 3 cents and minor supports at 2 cents. For now, volumes are low averaging 6.2 million which is nothing compared to massive involvement of Oct 11 and 15 averaging 44 million. As we can see, TRX/USD will only be bullish with gains above 3 cents or bearish with losses below 1.5 cents if and only if there are sharp spikes in market participation driving volumes above 50 million.
Candlestick Formation: Bear Breakout, Bear Flag
Thing is TRX/USD is bearish and as long as prices are below 3 cents, then the bear break out pattern of early August is valid. Besides, since prices are oscillating inside a rising channel, the bear flag with caps at 3 cents is true. It is likely that prices will dip below the minor support trend line which has been shoring TRX in the last two months.
Conclusion
Unless there are gains above 3 cents or Sep highs, then TRX/USD is bearish and could dip below 2 cents and drift towards 1.5 cents confirming losses of early August. As it is, traders should wait for strong losses below 2 cents and support trend line before opening shorts with stops at 2.5 cents.
All charts courtesy of Trading View
This is not Trading Advice, do your own Research


